![]() It is absolutely delightful for me to see that after years of publishing one poll after another without much analysis and presenting each difference as “news”, two major papers in Slovakia have begun to present long-term time-series data of polls. I suspect they will still present each new poll as “news” (though congratulations to them also for doing much more comparison and acknowledgment) but now readers can at least do some comparing on their own. A few brief thoughts on the two attempts
It is absolutely delightful for me to see that after years of publishing one poll after another without much analysis and presenting each difference as “news”, two major papers in Slovakia have begun to present long-term time-series data of polls. I suspect they will still present each new poll as “news” (though congratulations to them also for doing much more comparison and acknowledgment) but now readers can at least do some comparing on their own. A few brief thoughts on the two attempts
- Of the two the less ambitious effort is Pravda’s
 which is simply a story link containing tables of results from the major polls from January until the present. It does the job but without much visual impact. The full chart can be found here http://spravy.pravda.sk/prieskumy-agentur-focus-median-a-mvk-dvb-/sk-volby.asp?c=A100421_160242_sk-volby_p12. Since this is merely a story page it is not clear whether Pravda intends this as an ongoing feature or merely as a one-off presentation of the data. The omissions are also interesting: first, there are no smaller parties listed even though FOCUS does list the smaller parties and those parties sometimes rise to the level of relevance, if only in the way they take votes away from others (by this standard, SaS would not have qualified to appear on the list until November of 2009); the other interesting omission is Median, the polling firm with the “you name it” methodology. I have been critical of this in the past and suggested that the poll is out of line, so its omission is justified here. I use Median to look at trends, but without graphics (as in Pravda’s case) this is not as relevant and including Median might simply be confusing.
 - Sme’s effort is rather more ambitious
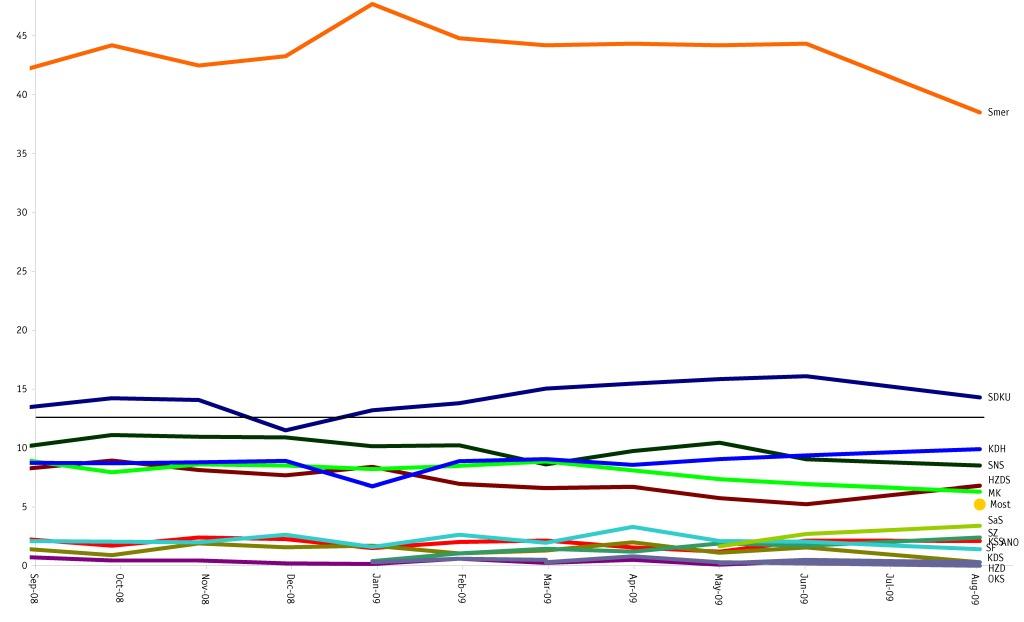
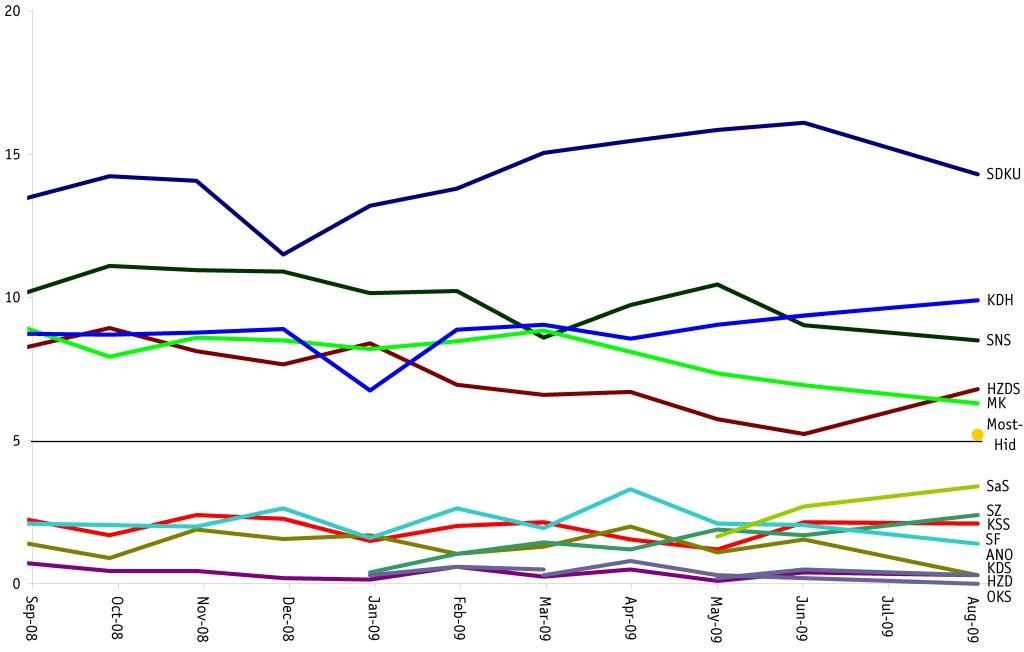
 , a graphic interface with three parts. The top one shows politicians standing next to lines representing party support and four buttons for polling firms. Clicking on the poll button shows the results for the most recent iteration of the poll and the month in which it was taken. Hovering over the individual politicians and lines shows the numerical level of support for the party. This is great, and it is great to have a choice, but there are two minor problems: first, the lines are dwarfed by the pictures of the politicians and so it is hard to gauge the relative levels of support by eye, and you have to move the bar across to see numbers for individual parties so it is not easy to ‘eyeball’ the levels either. Of course this is a relatively minor problem (and one easily fixed). The second part of the display is a long-awaited (by me at least) effort to put party support for various polls and various time periods together in the same graph. I’ve been doing this on and off for several years in this blog (most recently in the Dashboard, above) and have been waiting for a long time for Slovak papers to do it so I wouldn’t have to and could focus on the analysis rather than the creation of the graphics. Unfortunately, while this comes close it does not get close enough for me to be able to shut down my efforts. There are several minor but significant problems: first, the graphic rounds the numbers off to the nearest percentage point, which is actually fine for most parties but problematic in discerning key trends for smaller parties where rounding up or down may actually mean mischaracterizing party support by up to 10%; second, and most important, the graphic puts lines and dots where they do not belong. Because it measures in one month increments, it puts dots even where polling firms did not issue polls (and the reader has no way of knowing when without looking at Pravda or my own data); it also puts all polls on the same line when in fact they may have been taken at significantly different periods during a month, something that becomes important as we get into the final months; the biggest problem is that it carries these forward from “present” levels, suggesting, for example, that we have data for Premier polls in April (or MVK in March and April) when we simply do not. Still, this is such a big improvement over what has been done before that I am extremely impressed, and the problems above could probably be fixed by a clever webdesigner in about 2 hours. The last part of Sme’s graphics is an assessment of the number of parliamentary seats produced by the results in question using “person” icons. This is fine, but takes up much more space than it needs to do and does not easily tell the important story (mine doesn’t either, and I should fix that) which is how much that represents for various coalition combinations.
All of this means that I’m not yet ready to leave the dashboard business, but the great news is that the average consumer of news in Slovakia now has a relatively easy method for assessing the meaning of claims about polls and that is fantastic. It also means that Slovaks, for the moment at least, have pulled ahead of their Czech neighbors who also have an election coming up and whose Lidove Noviny publishes what was, until Sme, the best graphical analysis: http://www.lidovky.cz/ln-volby-ps10.asp?v=preference. The graphics here are better and more readable than Sme’s but they lack the comparative polling elements (and therefore the implicit “trendfinder” capability) that Sme has introduced. Perhaps it is time for me to get into the Czech dashboard business as well. Until the papers catch up again.
 I know Slovakia’s journalists are overtaxed with all that is required of them, but there are things they could do to make things better without too much extra work. Case in point: today all major Slovak news sources today report, almost word for word, a press release from the firm Median reporting poll results from July: