
 How well do public opinion polls in Slovakia predict election outcomes? Well as the previous post suggests, not too well. But they’re all we’ve got. Of course we could always wait until the future comes to us, but, frankly, where’s the fun in that. So rather than sit around and wait or make faulty predictions, we can try to figure out where and when the data we do have is most useful. We can get a bit more mileage out of the data if we understand its strengths and limitations on three dimensions: time period, pollster and party (It is theoretically possible to go further and divide it by categories within the surveyed population, but that requires the original data which is available only for limited periods and certain pollsters and so I will hold off on that for the moment.) It is no surprise that recent data is better than old data, but even that generalization has its limits. And while we can’t assume that polls will err in the future in the same way as in the past, it is important to know where the diversion between poll and reality crept in.
Time: Polls get better closer to elections. Sort of.
As we elections near, shouldn’t polls become more predictive? Yes, but not in a purely linear fashion. I do not have a lot of data on this–only 3 elections, two of which were for the European parliament–but what I do have suggests that increases in predictiveness really only begins about 6 months before the election. The graph below shows the differences in raw percentage points between poll “predictions” and actual results extending backward from election day.

Predictiveness of average poll results or major parties, approaching election
There is quite a bit in these finding are news to me:
- Improvement is not linear. I did not expect the “reversal” that occurs between one and two years out in each case–such that in each elections predictions made about 500 days before the election would be better than those made 200 days before the election. Of course it is impossible to predict on what day to make the best predictions (for Slovakia’s parliament in 2006, T-500 days was better than T-700 or T-200, but this was not true for the 2009 Euroelections.
- Europarliament predictions do not get better over time; Slovak parliament predictions do. Nor did I expect, though I should have, that predictions in Europarliament elections actually don’t get any better over time. This is clearly related, I think, to the low voter turnout in Euroelections. In this case the polls are considerably more representative than the elections themselves. The results for Slovakia’s parliament, by contrast, have plateaus and valleys but do get closer to actual results with time. (And one small footnote: I worried that the results above were the result of differences in polling patterns: Slovak parliamentary elections have more polls and might therefore be more accurate. But when I re-ran the numbers with only a single polling firm–UVVM–I got essentially the same results, suggesting that the patterns do not depend on the polling density).
- Sharp increases in predictiveness come in the last 150 days. For two of the three polls, the best increase in accuracy came in the final five months and since today we are at entering month 4, we are already in that period. Using these models (a rather thin basis for comparison) we could guess that we are just leaving the period of relatively low predictability and so any judgments made on the basis of polls to date should be taken with some care. By a month out, we can make guesses about the final result that are not overwhelmingly different from the final rush of polls. That’s not true today.
Pollster: Some firms are better than others, but not by too much
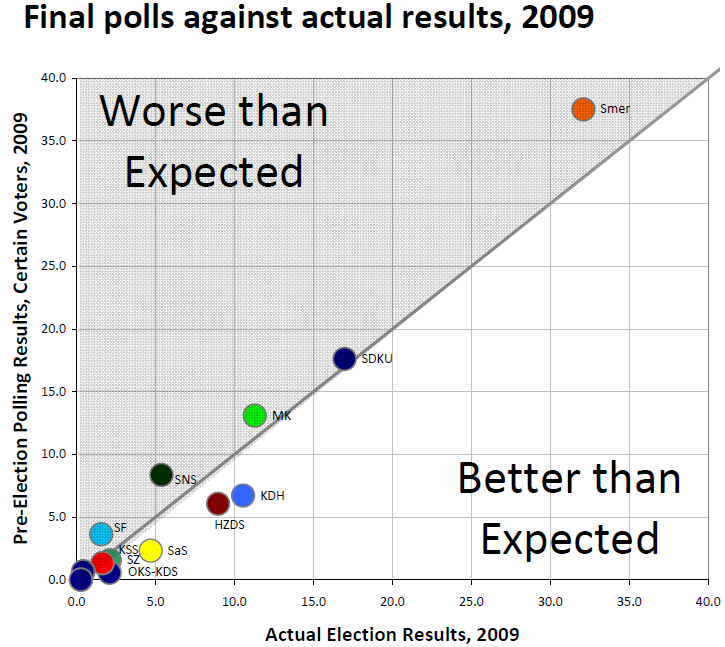
The second big question of accuracy depends on the pollster. It may be that some firms are simply better than others and that to average them together is to inject unnecessary noise. The graph below shows the errors in poll predictivness for each major polling firm’s final pre-election survey in four elections: Slovakia’s parliament in 2002, Europarliament in 2004, Slovakia’s parliament in 2006 and Europarliament again in 2009. Gray boxes mark “final” polls taken more than a month before the election.

Errors in poll predictivness by pollster 2002-2009
In this case the data–closer to the bottom means less error and more predictiveness–lends itself to several relatively clear conclusions (the full data set is at the bottom):
- Slovakia’s parliamentary elections produce small differences. During parliamentary elections–the first and third clusters–all firms tend to cluster closely together with a very small difference among them. These surveys tend to be large enough and carefully-enough framed, and with voters sufficiently politicized that the polls tend to converge around a single answer. The only exceptions here–Median and FOCUS–are not exceptions at all since these (like Median in 2009) are polls taken a month previously and (as the previous section shows) a month makes a some degree of difference (about 0.5 or so).
- Europarliament elections produce bigger differences. During Europarliament elections the spreads are much greater and the number of pollsters much smaller. Here the differences among pollsters would matter (if Slovaks felt that the elections themselves actually mattered, which most appear not to do).
With regard to specific pollsters, two stand out, but they have either ceased their work in this or work quite infrequently:
- UVVM was an excellent pollster and the decision by the Slovak Statistical Office not to continue these tests is a big loss.
- OMV does good polls. It’s a pity they only do them immediately before elections. (As an aside, no matter how good its polls may be, they cannot be used as a substitute for exit polls, as STV tried to do in 2006. Even the best, biggest pre-election poll seems destined to miss something).
Of the pollsters who still regularly poll (and with the exception of MVK, post results with increasing regularity) we can say the following”
- FOCUS has done a mediocre job in parliamentary elections but an excellent job in Euroelections. Without UVVM it is at the most reliable remaining pollster
- MVK, by these same calculations has done slightly worse than FOCUS but it too remains fairly solid.
- Median has not done as well and has been the high-end outlier in the two most recent elections (in 2009 its poll was taken a month before the election but its errant 2006 poll was taken in the final rush). This may be the result of Median’s open-ended preference question that does not as closely resemble the ballot process.
- The big surprise, and perhaps it is simply a coincidence, is that the telephone poll conducted by Polis in 2006 actually came close to the mark. Telephone polls have faced considerable criticism in the past, including my own, but this one worked. The 2010 election will provide a major test of its reliability.
Finally on the question of pollsters, it may be that no pollster is better overall but that some may be better or worse in detecting support for particular parties. As the Dashboard shows to even a casual observer (and as I will try to analyze in greater depth nearer to the election), some parties tend to do consistently better in some polls than in others. Does this translate into differences in electoral predictiveness? Again we face here a lack of data but what we have yields several conclusions about past patterns, though these are not particularly useful predictors for the future as they reflect a difference of at most a few points from the results of other pollsters. Nevertheless, we can say that compared to other pollsters,
- UVVM’s estimates for SDKU in all elections are less than those of other pollsters and its estimates for SNS and KDH are less than those of other posters in parliamentary elections. UVVM also overestimated HZDS in almost elections.
- OMV has underestimated Smer in parliamentary elections and underestimated SNS and KSS in parliamentary elections
- FOCUS has consistently underestimated HZDS and KDH, and has slightly overestimated Smer in parliamentary elections (while slightly underestimating the party in Europarliament elections). It has also slightly overestimated KSS in parliamentary elections
- Median has overestimated Smer in both elections for which we have its data and has underestimated SMK and HZDS and KDH (all rural parties, suggesting a weaker rural network of poll takers)
- MVK has overestimated Smer and KDH in parliamentary elections and underestimated SNS and KSS.
- With only one poll in, we have no way of making a broader assessment for Polis, but I for one will be very interested to see what happens next.
- Postscript: Just discovered this article about accuracy of presidential election results. It corresponds roughly to parliamentary election results with reasonable results for FOCUS, MVK and, surprisingly, Polis. See http://volby.sme.sk/c/4360649/statna-agentura-odhadla-vysledky-katastrofalne-a-facebook.html
Party: Some parties outrun the polls (sometimes)
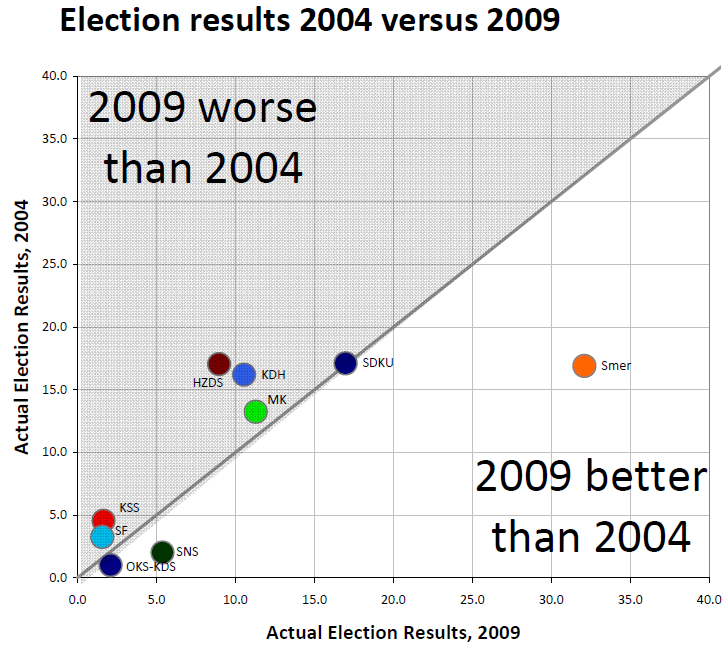
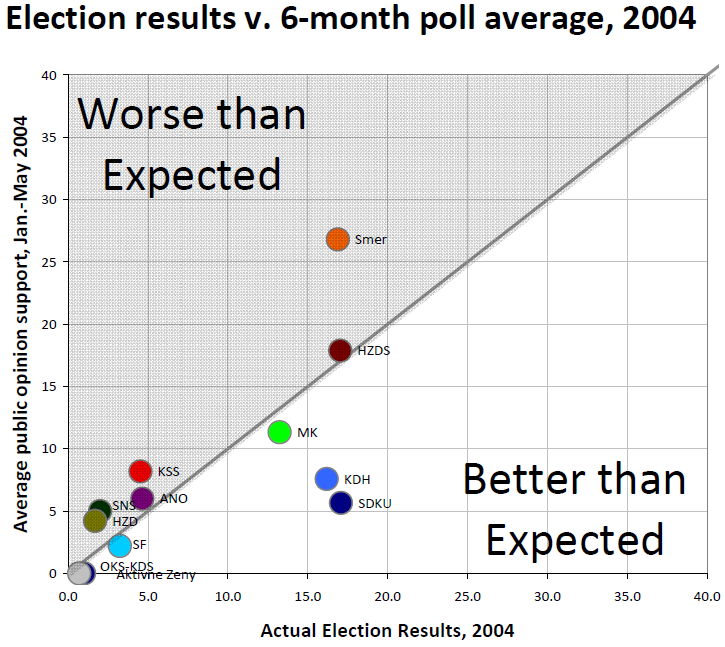
The most interesting question is whether polls as a whole tend to over-estimate or underestimate the electoral support of particular parties. This is a rather easy circumstance to imagine: the networks of pollsters do not extend to the ethnic or class group in which a particular party is strong, or a particularly segments of a party’s support base are overwhelmingly less (or more) likely to actually get out to the polls. The graph below lays out the differences between the averages of the final polls (white circles) and parties’ actual election results (color coded circles) for four elections: the parliamentary election in 2002, Europarliament in 2004, parliament again in 2006 and Europarliament again in 2009. The arrows (thick for parliamentary, thin for Europarliament) point from the poll prediction to the actual result.

- Poll predictivness in Slovakia 2002-2009
Only for a few parties do these arrows show clear patterns over time:
- SDKU has been underestimated by polls all four times, though the gap has narrowed considerably.
- SMK has also been underestimated, though by smaller amounts (and the gap in 2009 is the result of the emergence of Most-Hid which did not run candidates)
For several other parties patterns are less distinct:
- KDH and HZDS have been underestimated in Euroelections but results in parliamentary elections produce no clear result.
- For SNS there is likewise no clear pattern in parliamentary elections but a pattern of overestimation in Euroelections.
The biggest question, of course, is Smer, a party whose poll predictivness becomes an intensely political question. The results here suggest:
- A pattern of consistent overestimation in the polls by significant numerical (and even percentagewise) amounts in Euroelections and the 2002 parliamentary election…
- BUT (and this is a very important but) in the well-polled 2006 parliamentary elections the polls actually slightly underestimated Smer’s performance.
The Smer problem here is simply a large-scale representation of the problem that we find here in trying to make predictions against a moving target (the relationship between party poll support and voter turnout) and with very little data (N=2 for each kind of election). (Still, for those who are interested, I include the full data at the end of this post.)
This question has driven experts to find a variety of proxy measures to figure out how to adjust polling numbers to reflect the final outcomes. This post is already too long, however, so that will have to wait for another post (and lest this seem like an unfair cliff-hanger, know that the efforts so far have not produced a particularly compelling answer).
Data Tables for the Obsessive (by the obsessive)
| Election | Party | Major parties | Smer | SDKU | SNS | SMK | HZDS | KDH | KSS | HDZ | ANO | PSNS | SDA | SDL | SF | All Parties |
| 2002 Slovakia |
Average | +2.0 | +3.8 | -4.7 | +0.8 | -0.9 | -0.8 | -0.8 | -2.1 | +2.0 | +0.8 | -0.5 | +0.3 | +0.6 | +1.5 | |
| OMV-SRo | +1.8 | +2.3 | -5.6 | +1.6 | -0.4 | +1.0 | -0.5 | -1.2 | +1.9 | +0.3 | -0.5 | +0.6 | +0.6 | +1.4 | ||
| UVVM | +1.8 | +1.7 | -6.6 | +0.3 | -1.1 | -0.8 | -1.1 | -1.4 | +2.1 | -0.2 | -0.7 | -0.4 | +1.4 | +1.5 | ||
| Markant | +2.0 | +4.3 | -4.2 | +0.7 | -2.3 | +0.5 | +0.4 | -1.8 | +1.1 | +1.0 | -0.4 | +0.2 | +0.6 | +1.5 | ||
| Dicio | +2.1 | +4.2 | -2.8 | +0.4 | -0.8 | -2.2 | -1.4 | -3.0 | +2.8 | +1.4 | -0.6 | -0.2 | +0.2 | +1.7 | ||
| MVK | +2.3 | +5.0 | -4.7 | +0.4 | -0.8 | -1.9 | +0.1 | -3.5 | +1.2 | +1.0 | -0.3 | +0.8 | +0.2 | +1.7 | ||
| FOCUS | +2.3 | +5.2 | -4.6 | +1.4 | -0.1 | -1.4 | -2.3 | -1.5 | +2.8 | +1.2 | -0.6 | +0.7 | +0.8 | +1.9 | ||
| 2004 Europarliament |
Average | +4.3 | +9.0 | -8.5 | +1.8 | -1.7 | -0.9 | -7.0 | +1.1 | +2.4 | +0.5 | -0.4 | +3.5 | |||
| FOCUS | +3.0 | +0.7 | -7.9 | -1.1 | +0.4 | -1.4 | -8.4 | -1.3 | +3.2 | +1.6 | -0.4 | +2.6 | ||||
| OVM | +4.5 | +8.5 | -7.3 | +3.4 | -2.9 | -1.6 | -5.6 | +2.0 | +2.1 | +0.6 | +0.4 | +3.3 | ||||
| UVVM | +5.0 | +13.3 | -9.2 | +2.7 | -2.1 | +1.0 | -6.9 | -0.1 | +2.6 | +0.1 | +0.2 | +3.8 | ||||
| Dicio | +5.7 | +13.4 | -9.6 | +2.4 | -1.9 | -1.5 | -7.1 | +4.0 | +1.8 | -0.3 | -1.8 | +4.4 | ||||
| 2006 Slovakia |
Average | +2.2 | -1.6 | -5.3 | -1.7 | -1.4 | +2.7 | +1.4 | +1.2 | +0.7 | +0.8 | +2.6 | +2.0 | |||
| OVM-Sro | +2.0 | -2.4 | -4.8 | +0.1 | -1.7 | +1.5 | +1.3 | +2.0 | +0.9 | +1.3 | +0.8 | +1.7 | ||||
| Polis | +2.2 | -2.5 | -4.7 | -1.1 | -0.4 | +2.5 | +3.3 | +0.6 | +1.4 | +0.8 | +0.3 | +1.8 | ||||
| UVVM | +2.2 | -0.6 | -5.7 | -2.0 | -1.4 | +4.1 | +0.6 | +1.2 | +1.7 | +0.9 | +1.1 | +1.9 | ||||
| MVK | +2.3 | -1.1 | -5.9 | -1.7 | -1.7 | +2.7 | +2.2 | +1.1 | -0.6 | -1.4 | +2.5 | +2.1 | ||||
| Dicio | +2.4 | -1.1 | -5.7 | -3.5 | -2.0 | +2.7 | -0.2 | +1.2 | +0.4 | +2.7 | +5.0 | +2.5 | ||||
| FOCUS | +3.2 | +2.6 | -8.9 | -3.6 | -1.9 | +2.3 | +1.4 | +1.6 | +1.6 | +2.0 | +2.5 | +2.8 | ||||
| Median | +3.4 | +0.7 | -10.6 | -3.6 | -3.2 | +1.8 | +1.1 | +2.7 | +3.5 | +1.1 | +5.5 | +3.4 | ||||
| 2009 Europarliament |
Average | +3.9 | +11.9 | -2.6 | +5.0 | -3.5 | -2.2 | -1.6 | -0.2 | -0.4 | +3.6 | |||||
| FOCUS | +3.3 | +8.4 | -1.2 | +3.4 | -2.7 | -3.7 | -2.6 | +1.1 | +0.8 | +3.0 | ||||||
| UVVM | +3.6 | +11.7 | -4.5 | +5.0 | -2.8 | -0.5 | -0.3 | -0.0 | -0.4 | +3.1 | ||||||
| MVK | +3.9 | +11.0 | -1.6 | +4.8 | -3.0 | -2.9 | -2.7 | +1.0 | +0.9 | +3.5 | ||||||
| Median | +5.0 | +15.8 | -2.0 | +6.5 | -4.8 | -2.6 | -1.9 | -1.7 | -1.6 | +4.6 |
dd
| Party | Parliamentary Election | Year | Poll Avg. | Result | Raw Poll Error | % Poll Error | Average Poll Error | Consistency |
| Smer | Slovakia | 2002 | 17.3 | 13.5 | 3.8 | 28% | 12% | Mixed |
| 2006 | 27.6 | 29.1 | -1.5 | -5% | ||||
| EU | 2004 | 25.9 | 16.9 | 9.0 | 53% | 46% | Consistently too high | |
| 2009 | 44.3 | 32.0 | 12.3 | 38% | ||||
| SDKU | Slovakia | 2002 | 10.4 | 15.1 | -4.7 | -31% | -30% | Consistently too low |
| 2006 | 13.0 | 18.4 | -5.4 | -29% | ||||
| EU | 2004 | 8.6 | 17.1 | -8.5 | -50% | -27% | Consistently too low | |
| 2009 | 16.1 | 17.0 | -0.9 | -5% | ||||
| SNS | Slovakia | 2002 | 4.1 | 3.3 | 0.8 | 23% | 5% | Mixed |
| 2006 | 10.1 | 11.7 | -1.6 | -14% | ||||
| EU | 2004 | 3.9 | 2.0 | 1.9 | 94% | 79% | Consistently too high | |
| 2009 | 9.1 | 5.6 | 3.5 | 64% | ||||
| MK | Slovakia | 2002 | 10.3 | 11.2 | -0.9 | -8% | -10% | Consistently too low |
| 2006 | 10.3 | 11.7 | -1.4 | -12% | ||||
| EU | 2004 | 11.6 | 13.2 | -1.6 | -12% | -26% | Consistently too low | |
| 2009 | 6.9 | 11.3 | -4.4 | -39% | ||||
| HZDS | Slovakia | 2002 | 18.7 | 19.5 | -0.8 | -4% | 13% | Mixed |
| 2006 | 11.5 | 8.8 | 2.7 | 31% | ||||
| EU | 2004 | 16.1 | 17.0 | -0.9 | -6% | -24% | Consistently too low | |
| 2009 | 5.2 | 9.0 | -3.8 | -42% | ||||
| KDH | Slovakia | 2002 | 7.5 | 8.3 | -0.8 | -9% | 4% | Mixed |
| 2006 | 9.7 | 8.3 | 1.4 | 17% | ||||
| EU | 2004 | 9.2 | 16.2 | -7.0 | -43% | -28% | Consistently too low | |
| 2009 | 9.4 | 10.9 | -1.5 | -14% | ||||
| KSS | Slovakia | 2002 | 4.2 | 6.3 | -2.1 | -33% | -1% | Mixed |
| 2006 | 5.1 | 3.9 | 1.2 | 31% | ||||
| EU | 2004 | 5.7 | 4.5 | 1.2 | 26% | 29% | Consistently too high | |
| 2009 | 2.2 | 1.7 | 0.6 | 33% | ||||
| SF | Slovakia | 2006 | 5.4 | 3.5 | 1.9 | 56% | 56% | No data |
| EU | 2004 | 2.9 | 3.3 | -0.4 | -11% | 11% | Mixed | |
| 2009 | 2.1 | 1.6 | 0.5 | 33% | ||||
| HZD | Slovakia | 2002 | 5.3 | 3.3 | 2.0 | 61% | 113% | Consistently too high |
| 2006 | 1.7 | 0.6 | 1.1 | 166% | ||||
| EU | 2004 | 4.1 | 1.7 | 2.4 | 143% | 143% | No average | |
| ANO | Slovakia | 2002 | 8.8 | 8.0 | 0.8 | 10% | 53% | Consistently too high |
| 2006 | 2.8 | 1.4 | 1.4 | 97% | ||||
| EU | 2004 | 5.2 | 4.7 | 0.6 | 12% | 12% | No average |

 A reader (for all I know, since I haven’t enabled the statistics package on this blog, the reader) notes the OKS-KDS ties to Libertas and asks about the chances to break the 5% threshold in the upcoming European elections. My rather limited response: