
For a blog ostensibly dedicated to Central and Eastern Europe, I’ve been spending a lot of time here on local politics. I hope my Central European friends won’t mind another (and the third that will inevitably follow the Presidential election, if that election campaign doesn’t eat its way through my brain by then).
So quick news on the Ferndale area voting results.
Turnout:
First, who voted: The answer, as usual, is the Woodward corridor, with highest turnout in the north. Pleasant Ridge always does well in the turnout stakes but by my quick calculations this year its turnout was the highest of any community in the county (both of its precincts were in the top 10 in a county of over 500 precincts). Ferndale, too, got one precinct into the top 20 (Northwest Ferndale’s precinct 1). Lowest turnout within the city of Ferndale was, as usual, in the eastern precincts, and in the region overall the turnout was lowest in Oak Park’s 12th precinct. The Charter Township of Royal Oak sometimes has low voter turnout but this summer’s spirited primary election campaign brought its turnout into line with central Ferndale and east Oak Park.
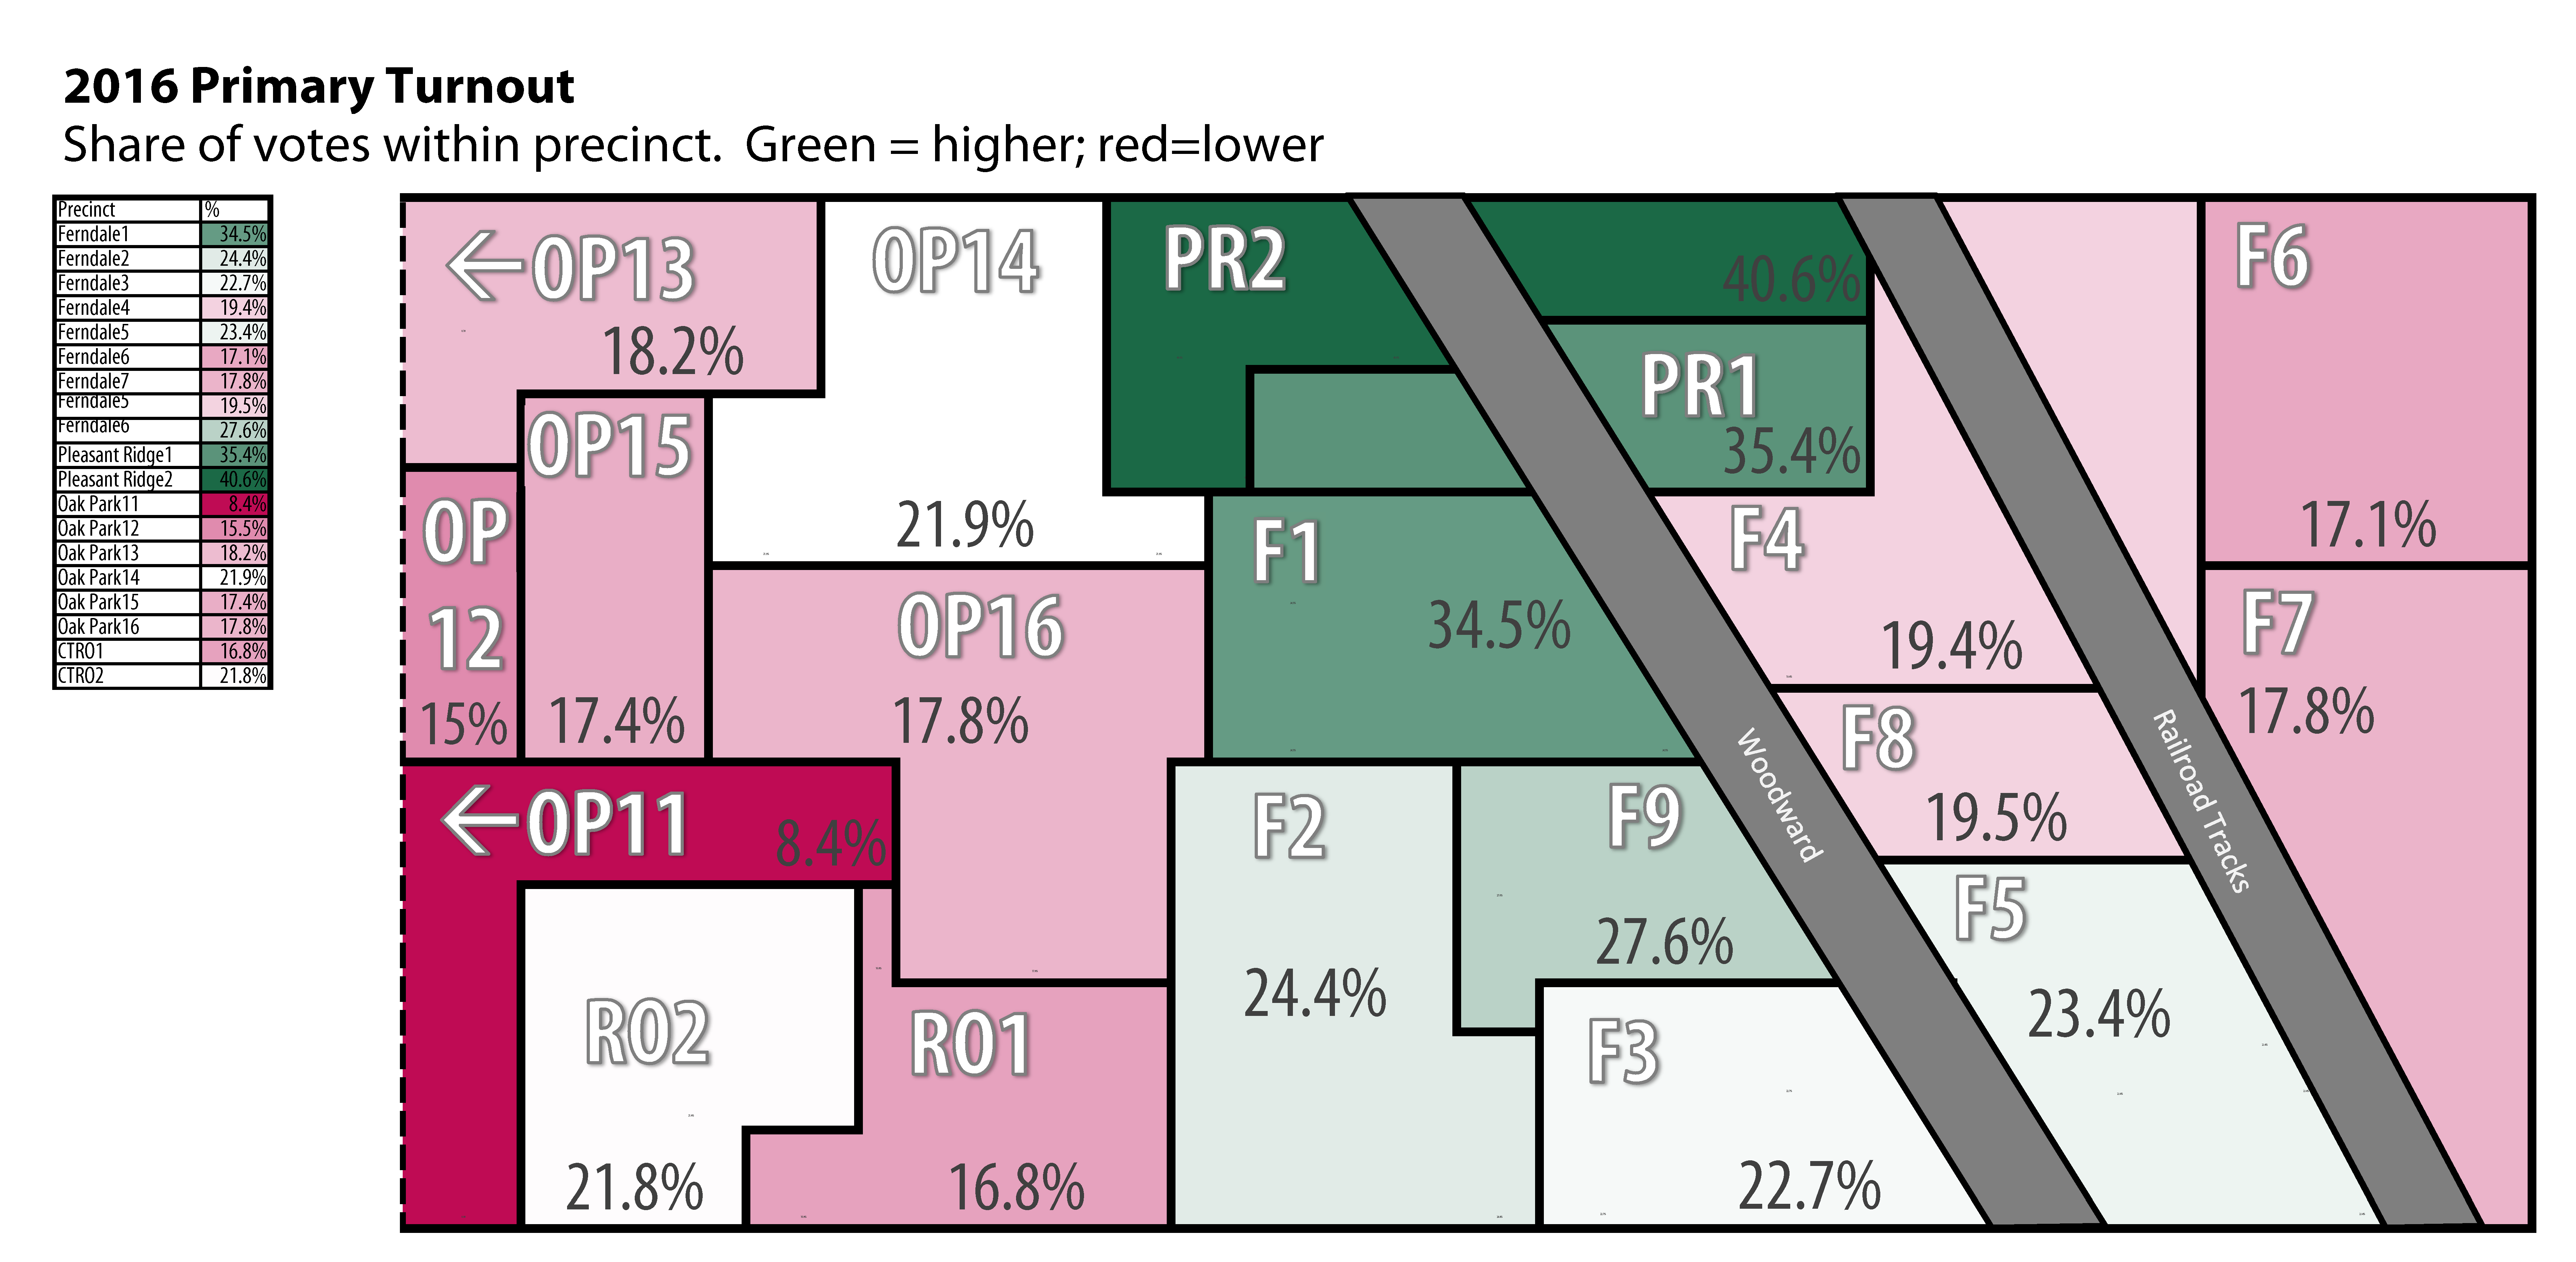
2016 August Turnout
Partisanship:
This is a primary so we cannot look at head-to-head contests between candidates from different parties, but we can look at differences between turnouts of parties in their respective primaries. This is sometimes quite misleading because differences in the competitiveness of some races can raise a party’s relative turnout. In this case there were relatively few contested races on either side and nothing to skew the results. Nor does this phenomenon affect our look at local precincts as I present them below:
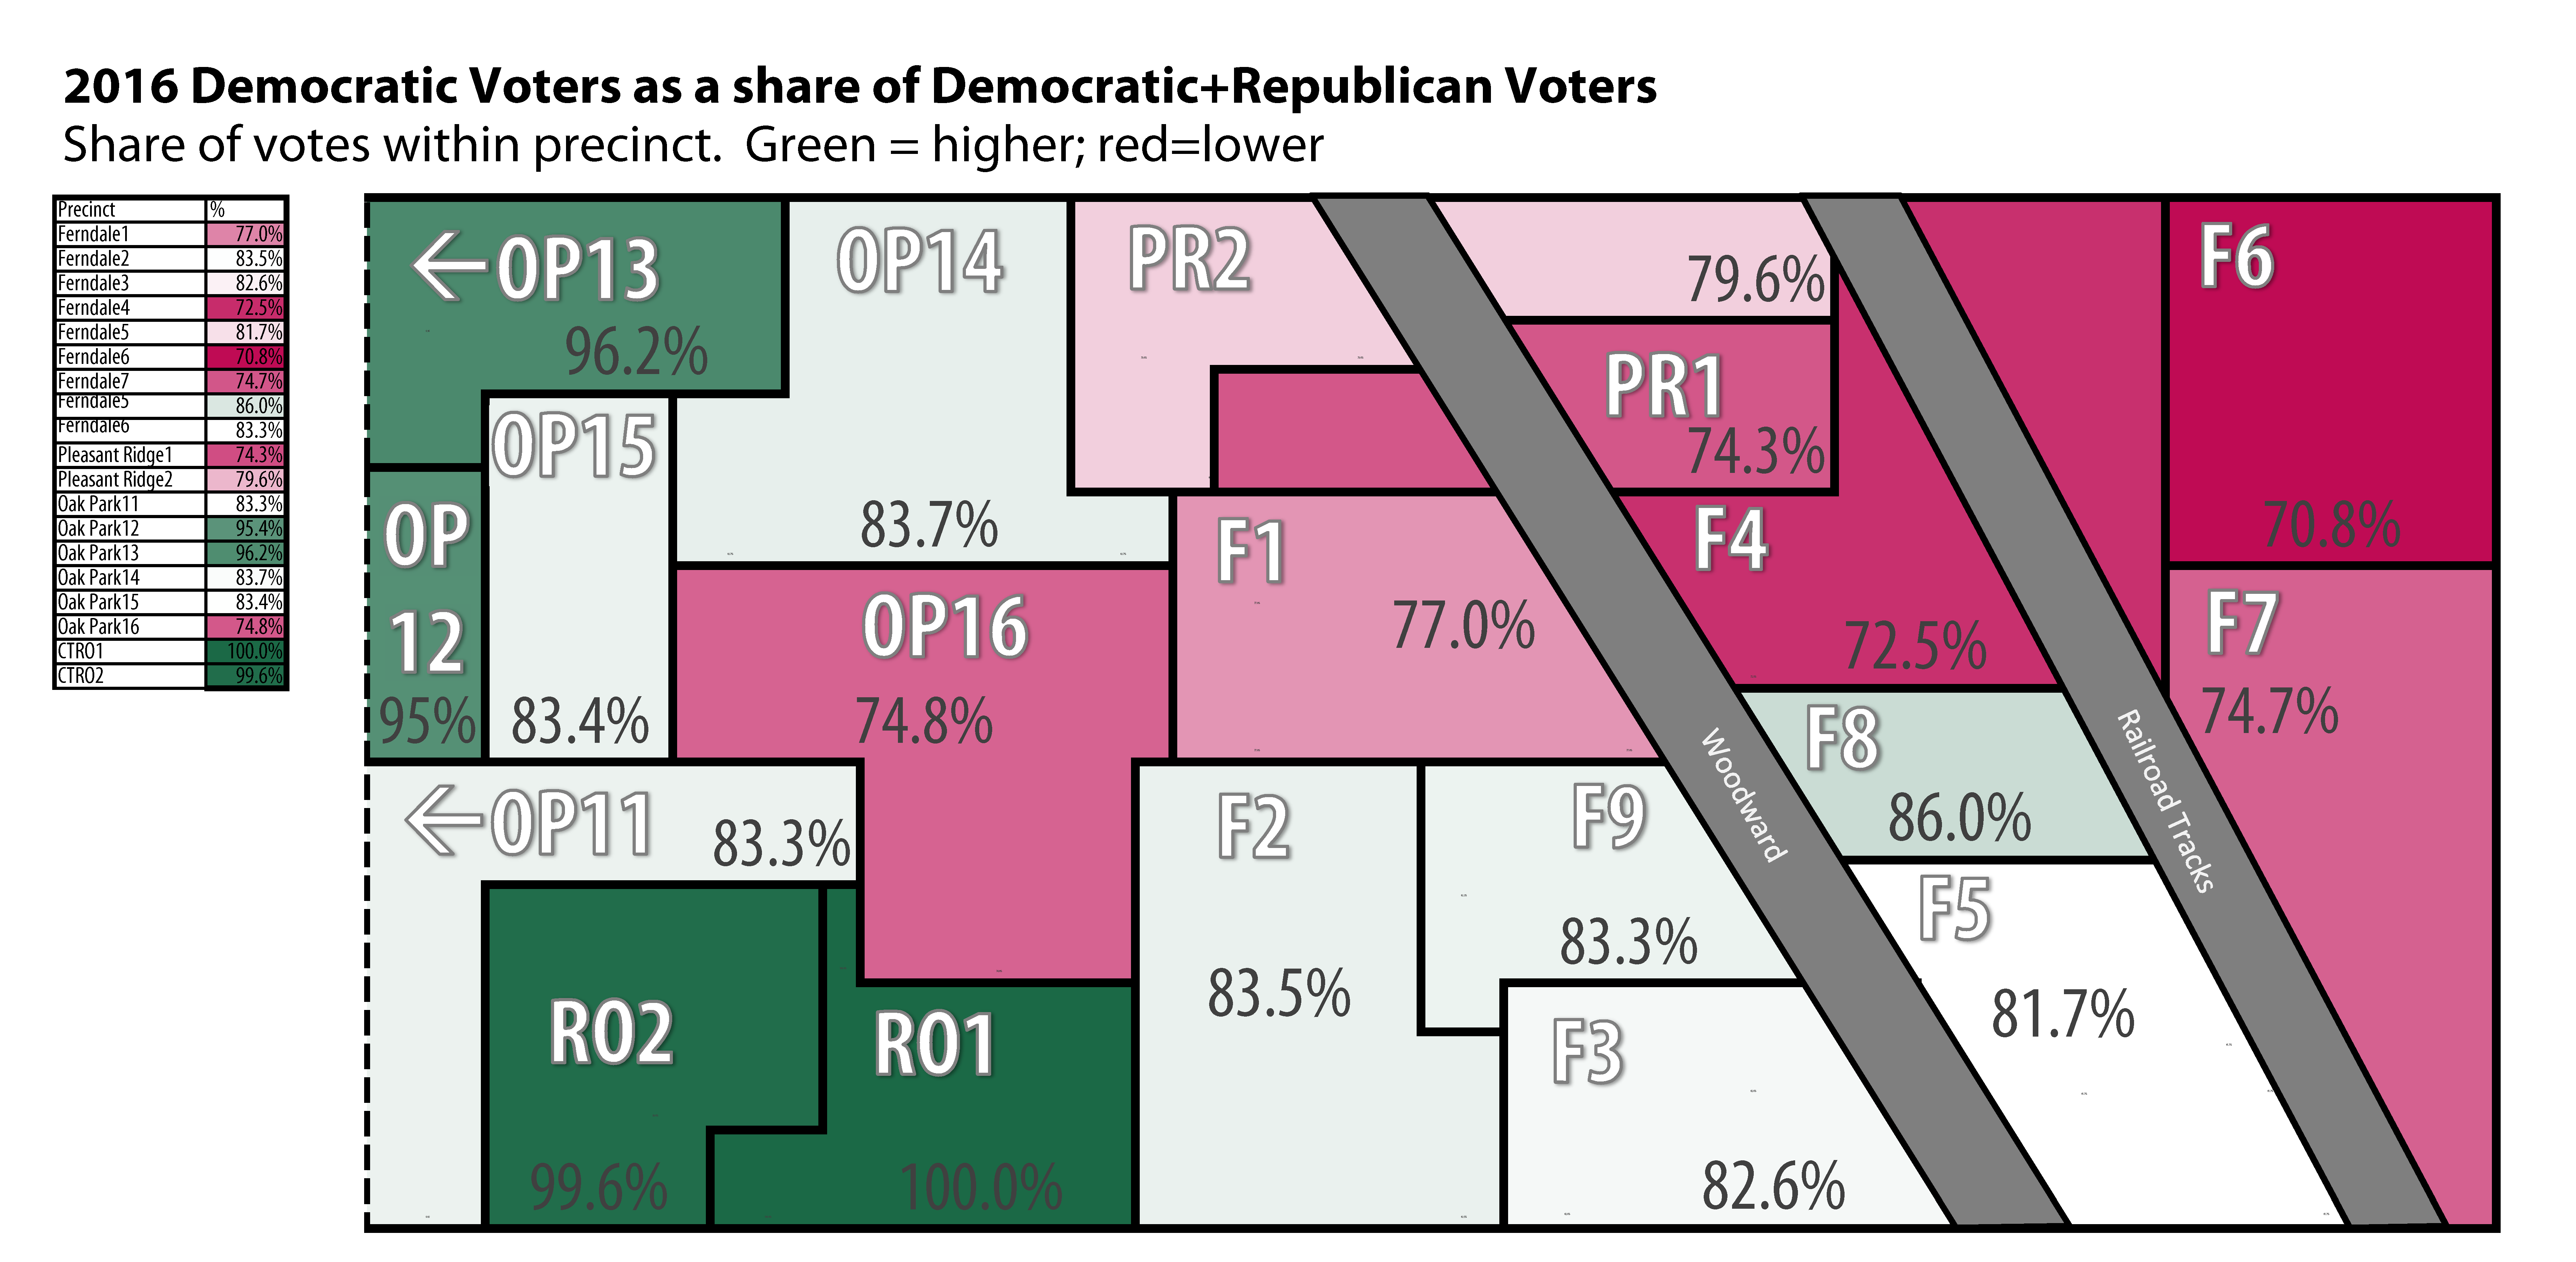
2016 August Voting Partisanship
Again, there is little surprise. There is no stronger Democratic bastion than the Charter Township of Royal Oak where only one—ONE—voter out of hundreds voted in the Republican Primary. Eastern Oak Park is almost equally Democratic, and within the city of Ferndale it is again the south-central precincts of Ferndale that are the most Democratic (with the addition this time of the central precinct 8 which proved unusually Democratic this time). But it’s always worth keeping in mind that the differences between these Democratic bastions and the least democratic precincts in a place like Ferndale is only about 10%-12% with even the least Democratic precinct still at 70%.
Results:
The millages both passed by significant margins: 72%:28% for the school millage and 65%:35% for the library millage.
For the schools this is a smaller margin than the 79%:21% in the 2015 Non-Homestead millage, (this was not a new tax and not one that affected homeowners, though not all voters knew that) but a bigger margin than the 69%:31% margin in the 2012 Bond millage (this had a large price-tag attached to it, though it was also seen by many as a renewal). For the library, this is a slightly smaller margin than the 69%:31% in the 2007 millage. The regional patterns tend to endure in both, despite shifts in margin.
The library pattern shows higher opposition in the east and strongest support in the center (right around the library) and in the west, but it is noteworthy that in the 9 years between the first vote and the second one, the regional differences dropped sharply: extremes of 97% and 44% (a 53 point gap) in 2007 fell to 72% and 58% (a 14 point gap).
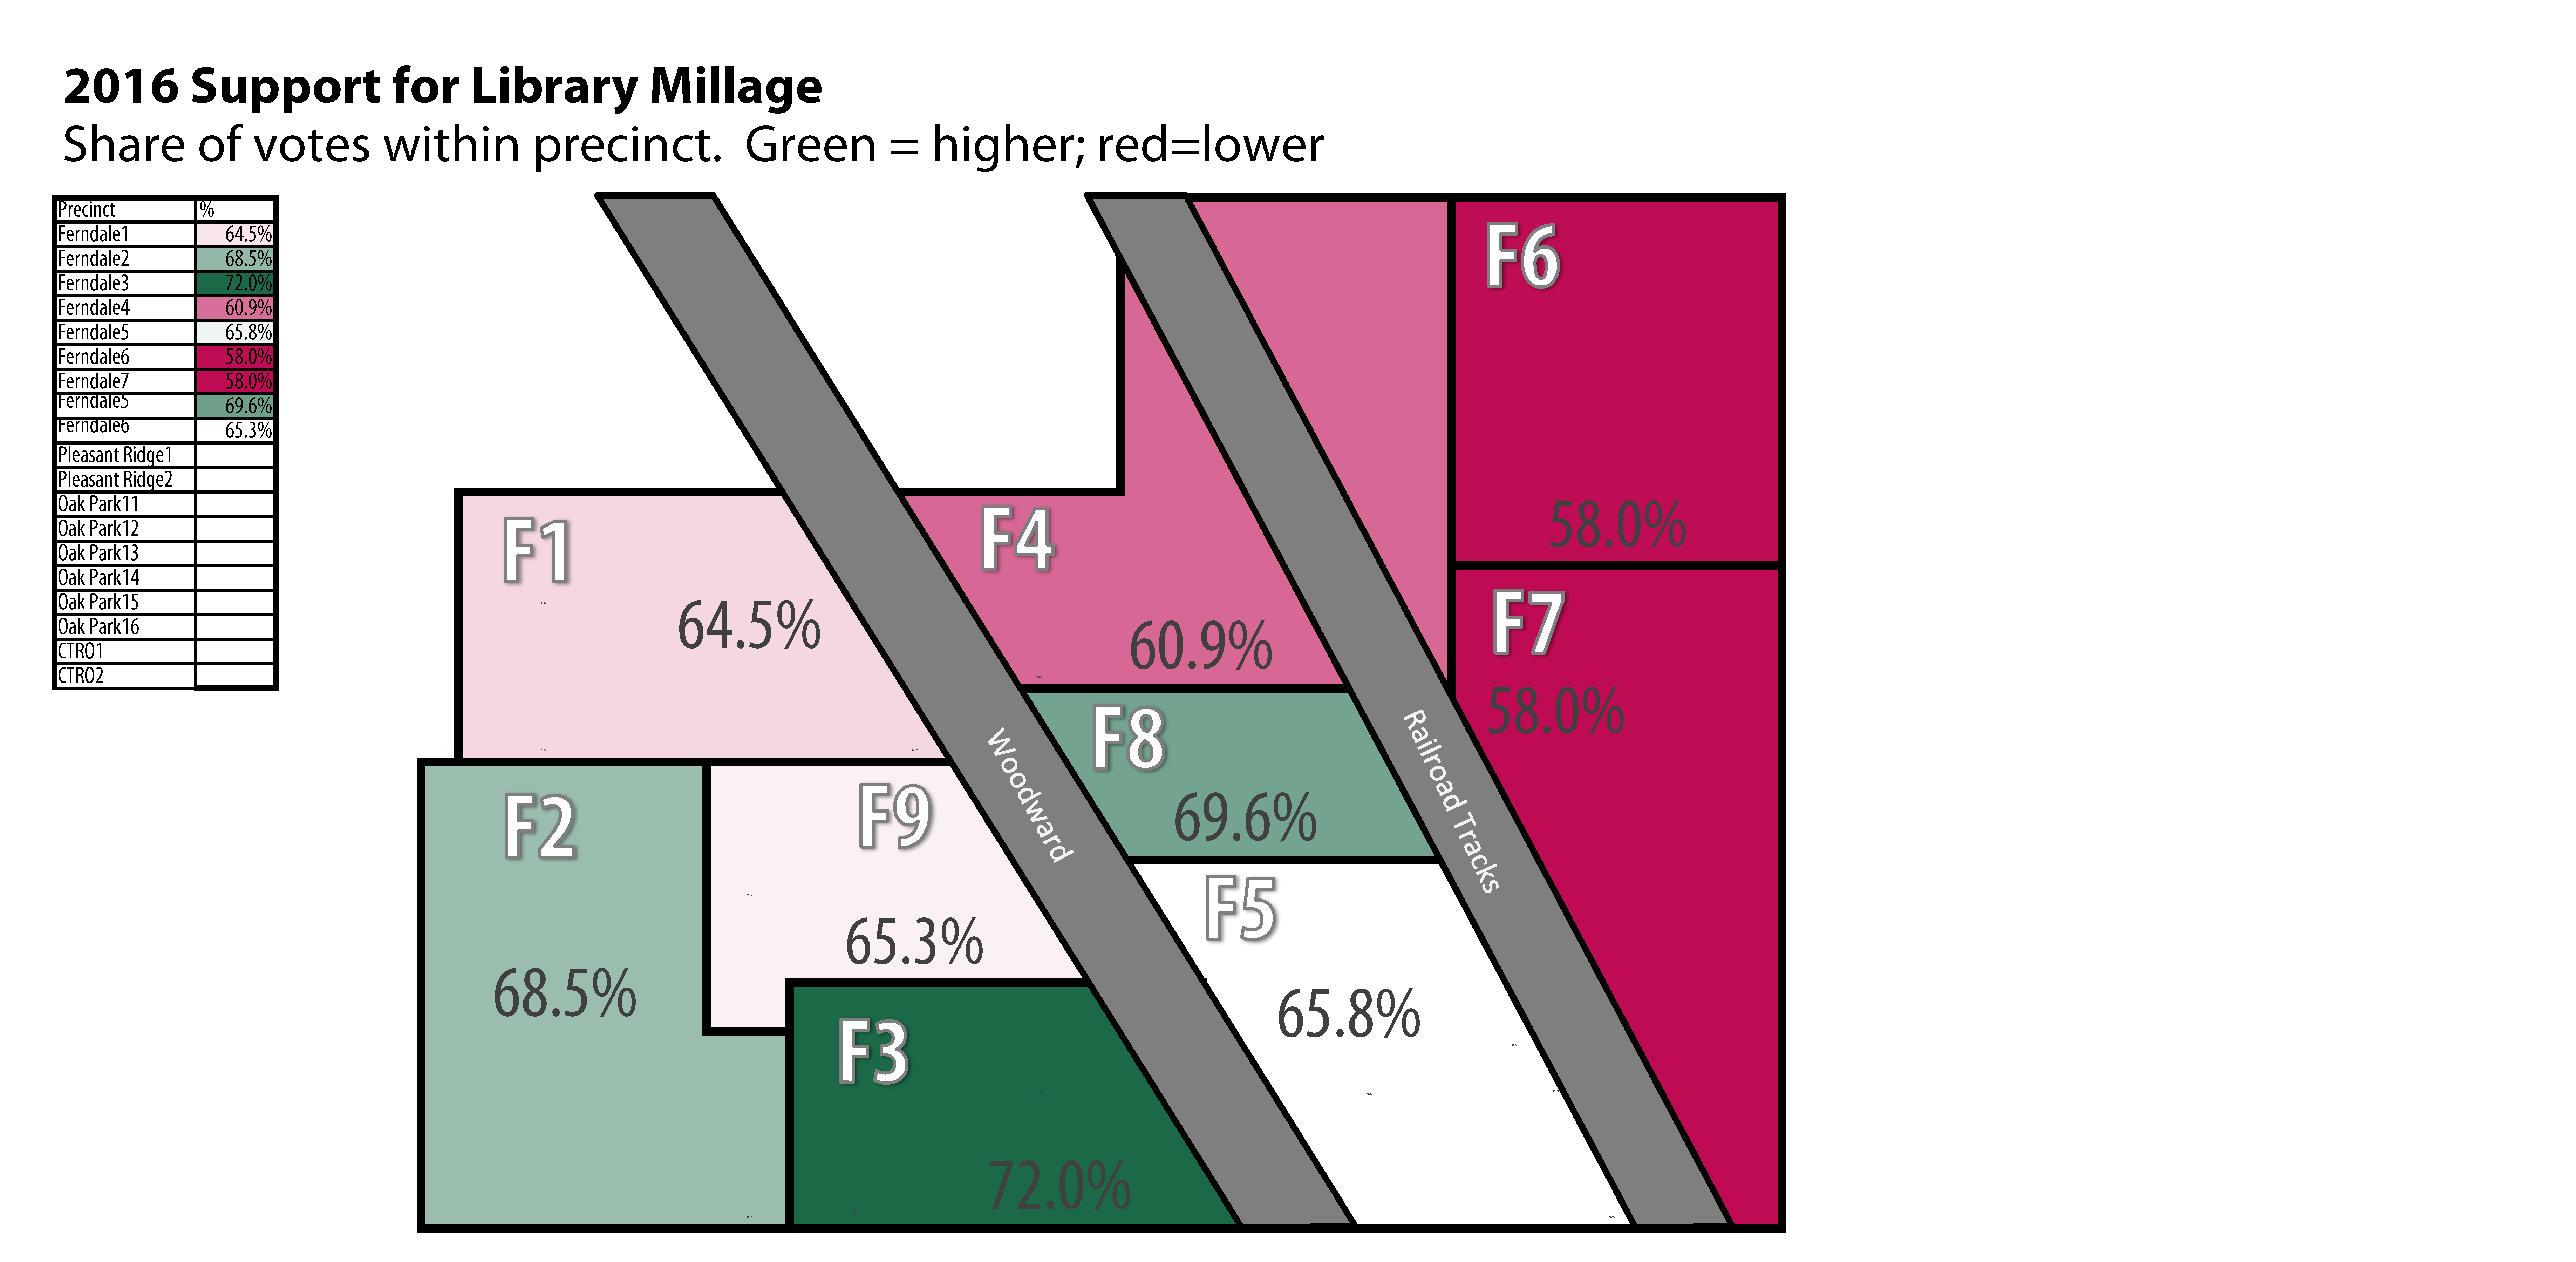
2016 Library Millage
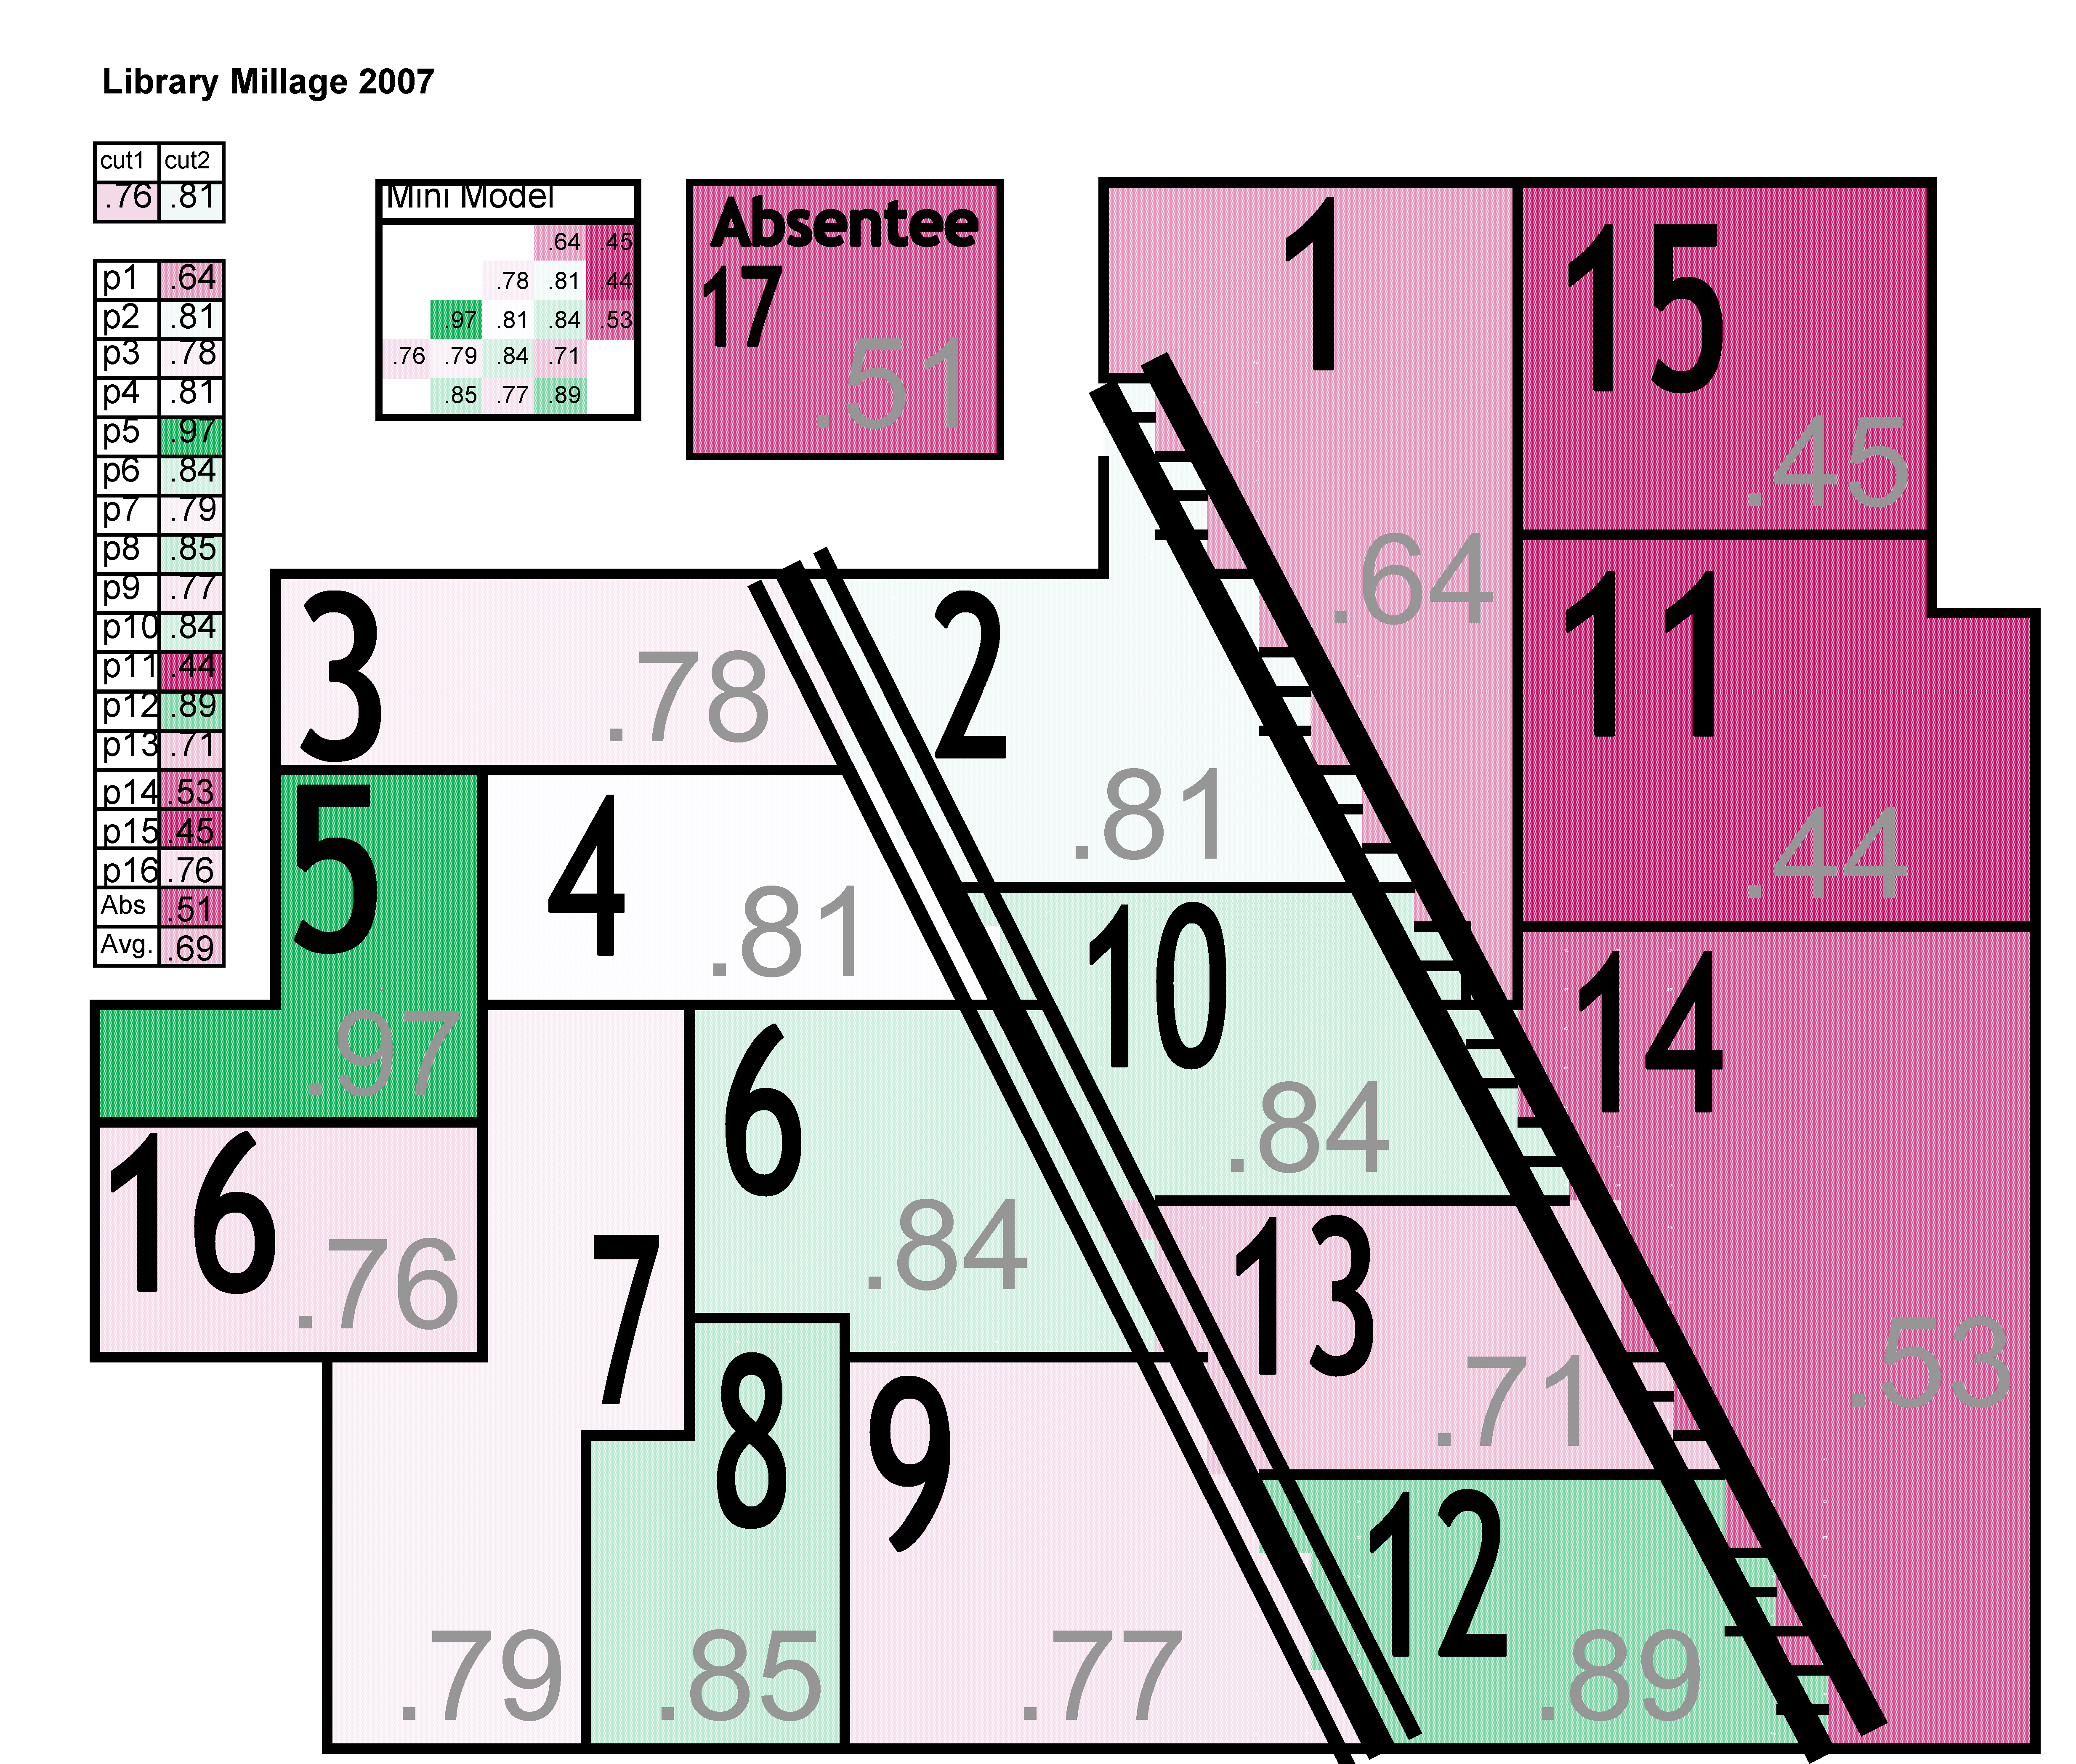
2007 Library millage
The schools’ regional pattern more or less echoes that of the library, though the addition of communities to the north and west (and the absence of precincts in the east) changes the dynamics. Within Ferndale the northern precincts on both sides of Woodward have been the most skeptical in all three of the most recent millages (and the pattern goes further back). Pleasant Ridge has been consistently the most supportive of school millages and Oak Park has been reasonably supportive as well, on one occasion slightly less than in southern Ferndale and on two occasions (including yesterday) slight more. Royal Oak Township has bounced a bit more strongly between high and low levels of support, but the precinct’s highly variable levels of turnout (Township elections run on different cycles than other forms of local government) could explain the shifts.
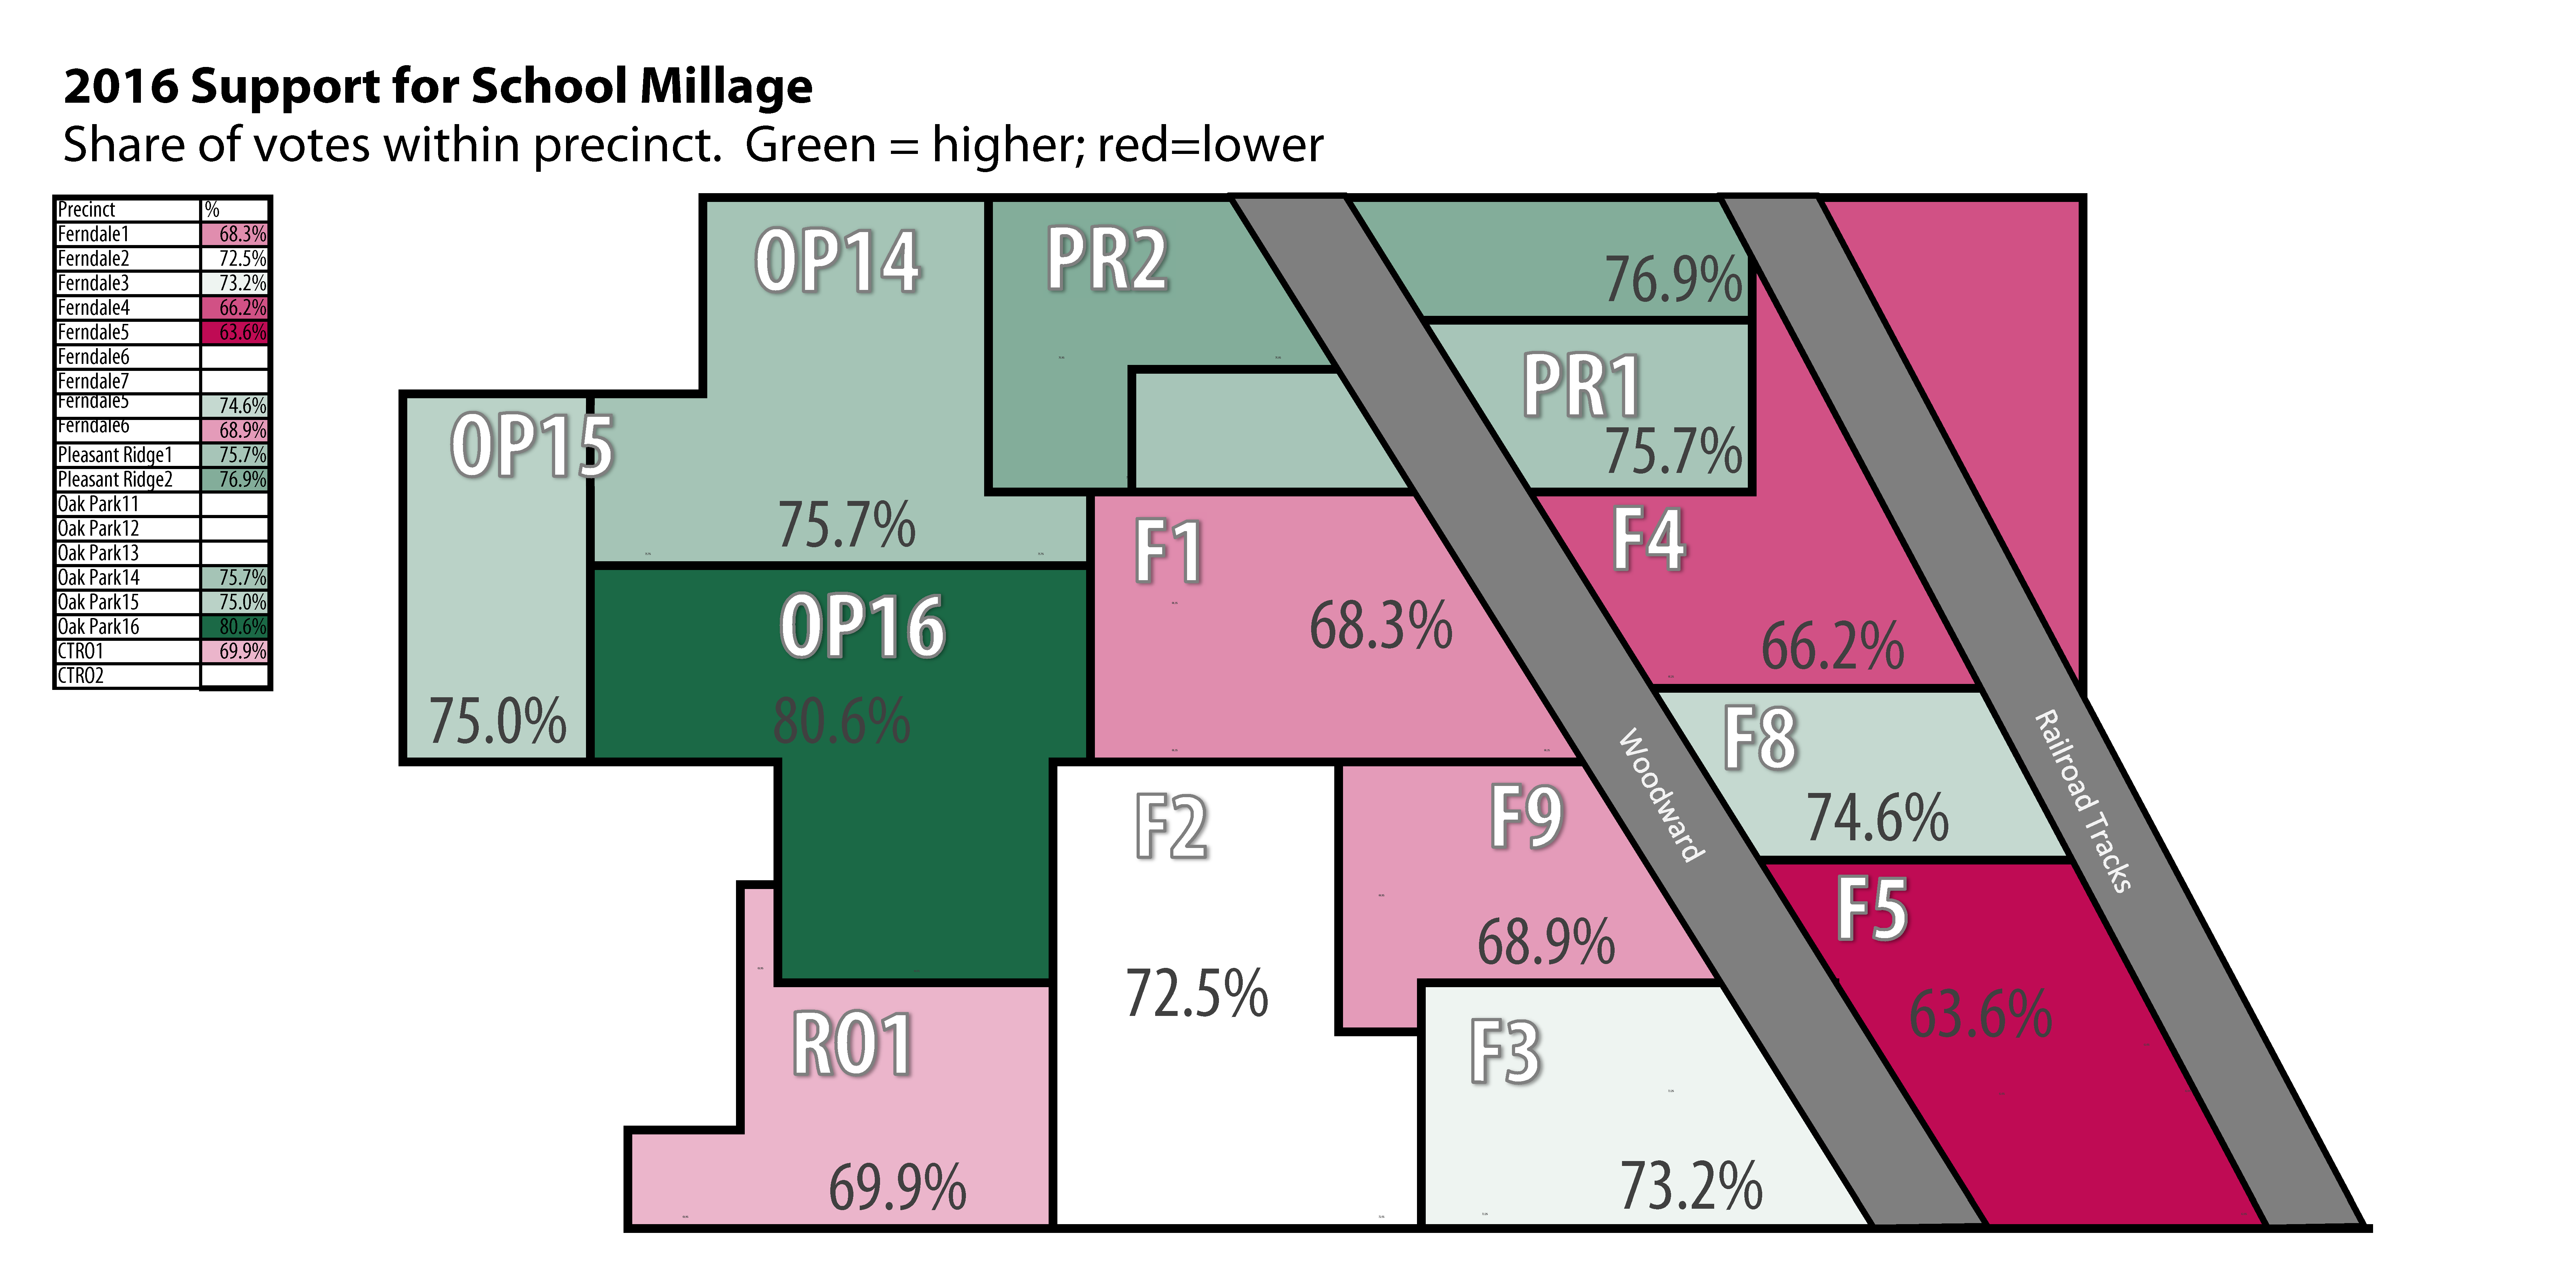
2016 School Sinking Fund Millage Results
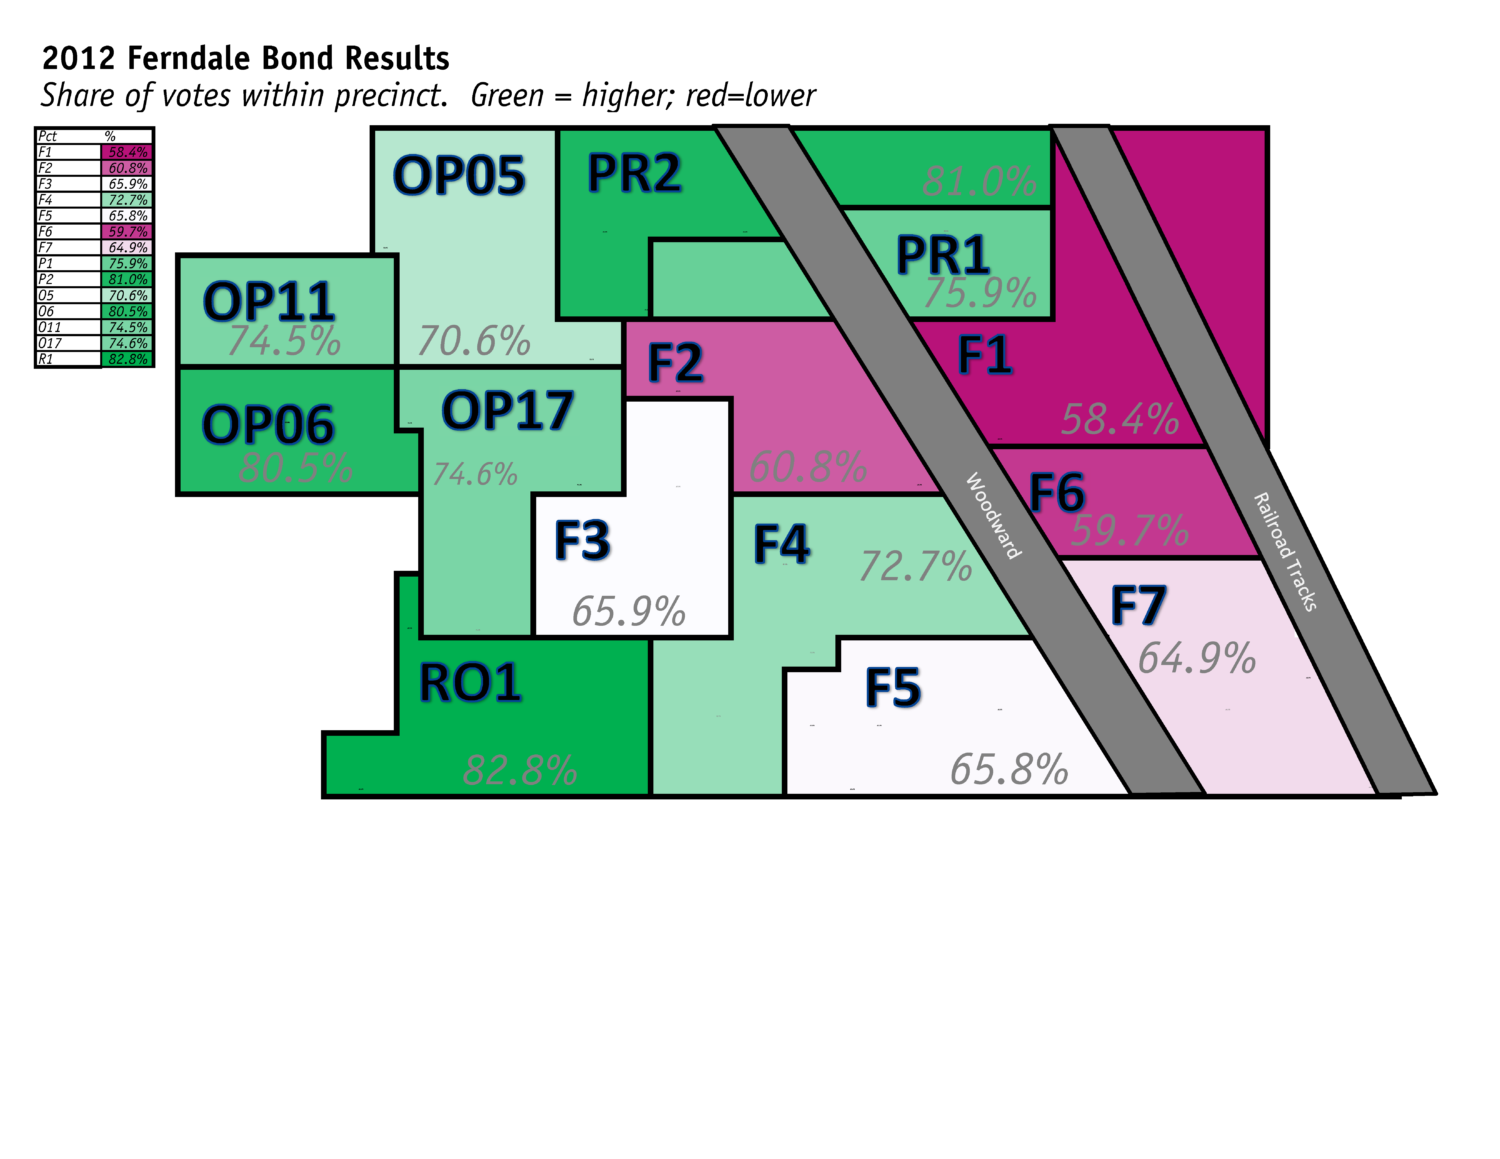 2012 Schools Bond Millage |
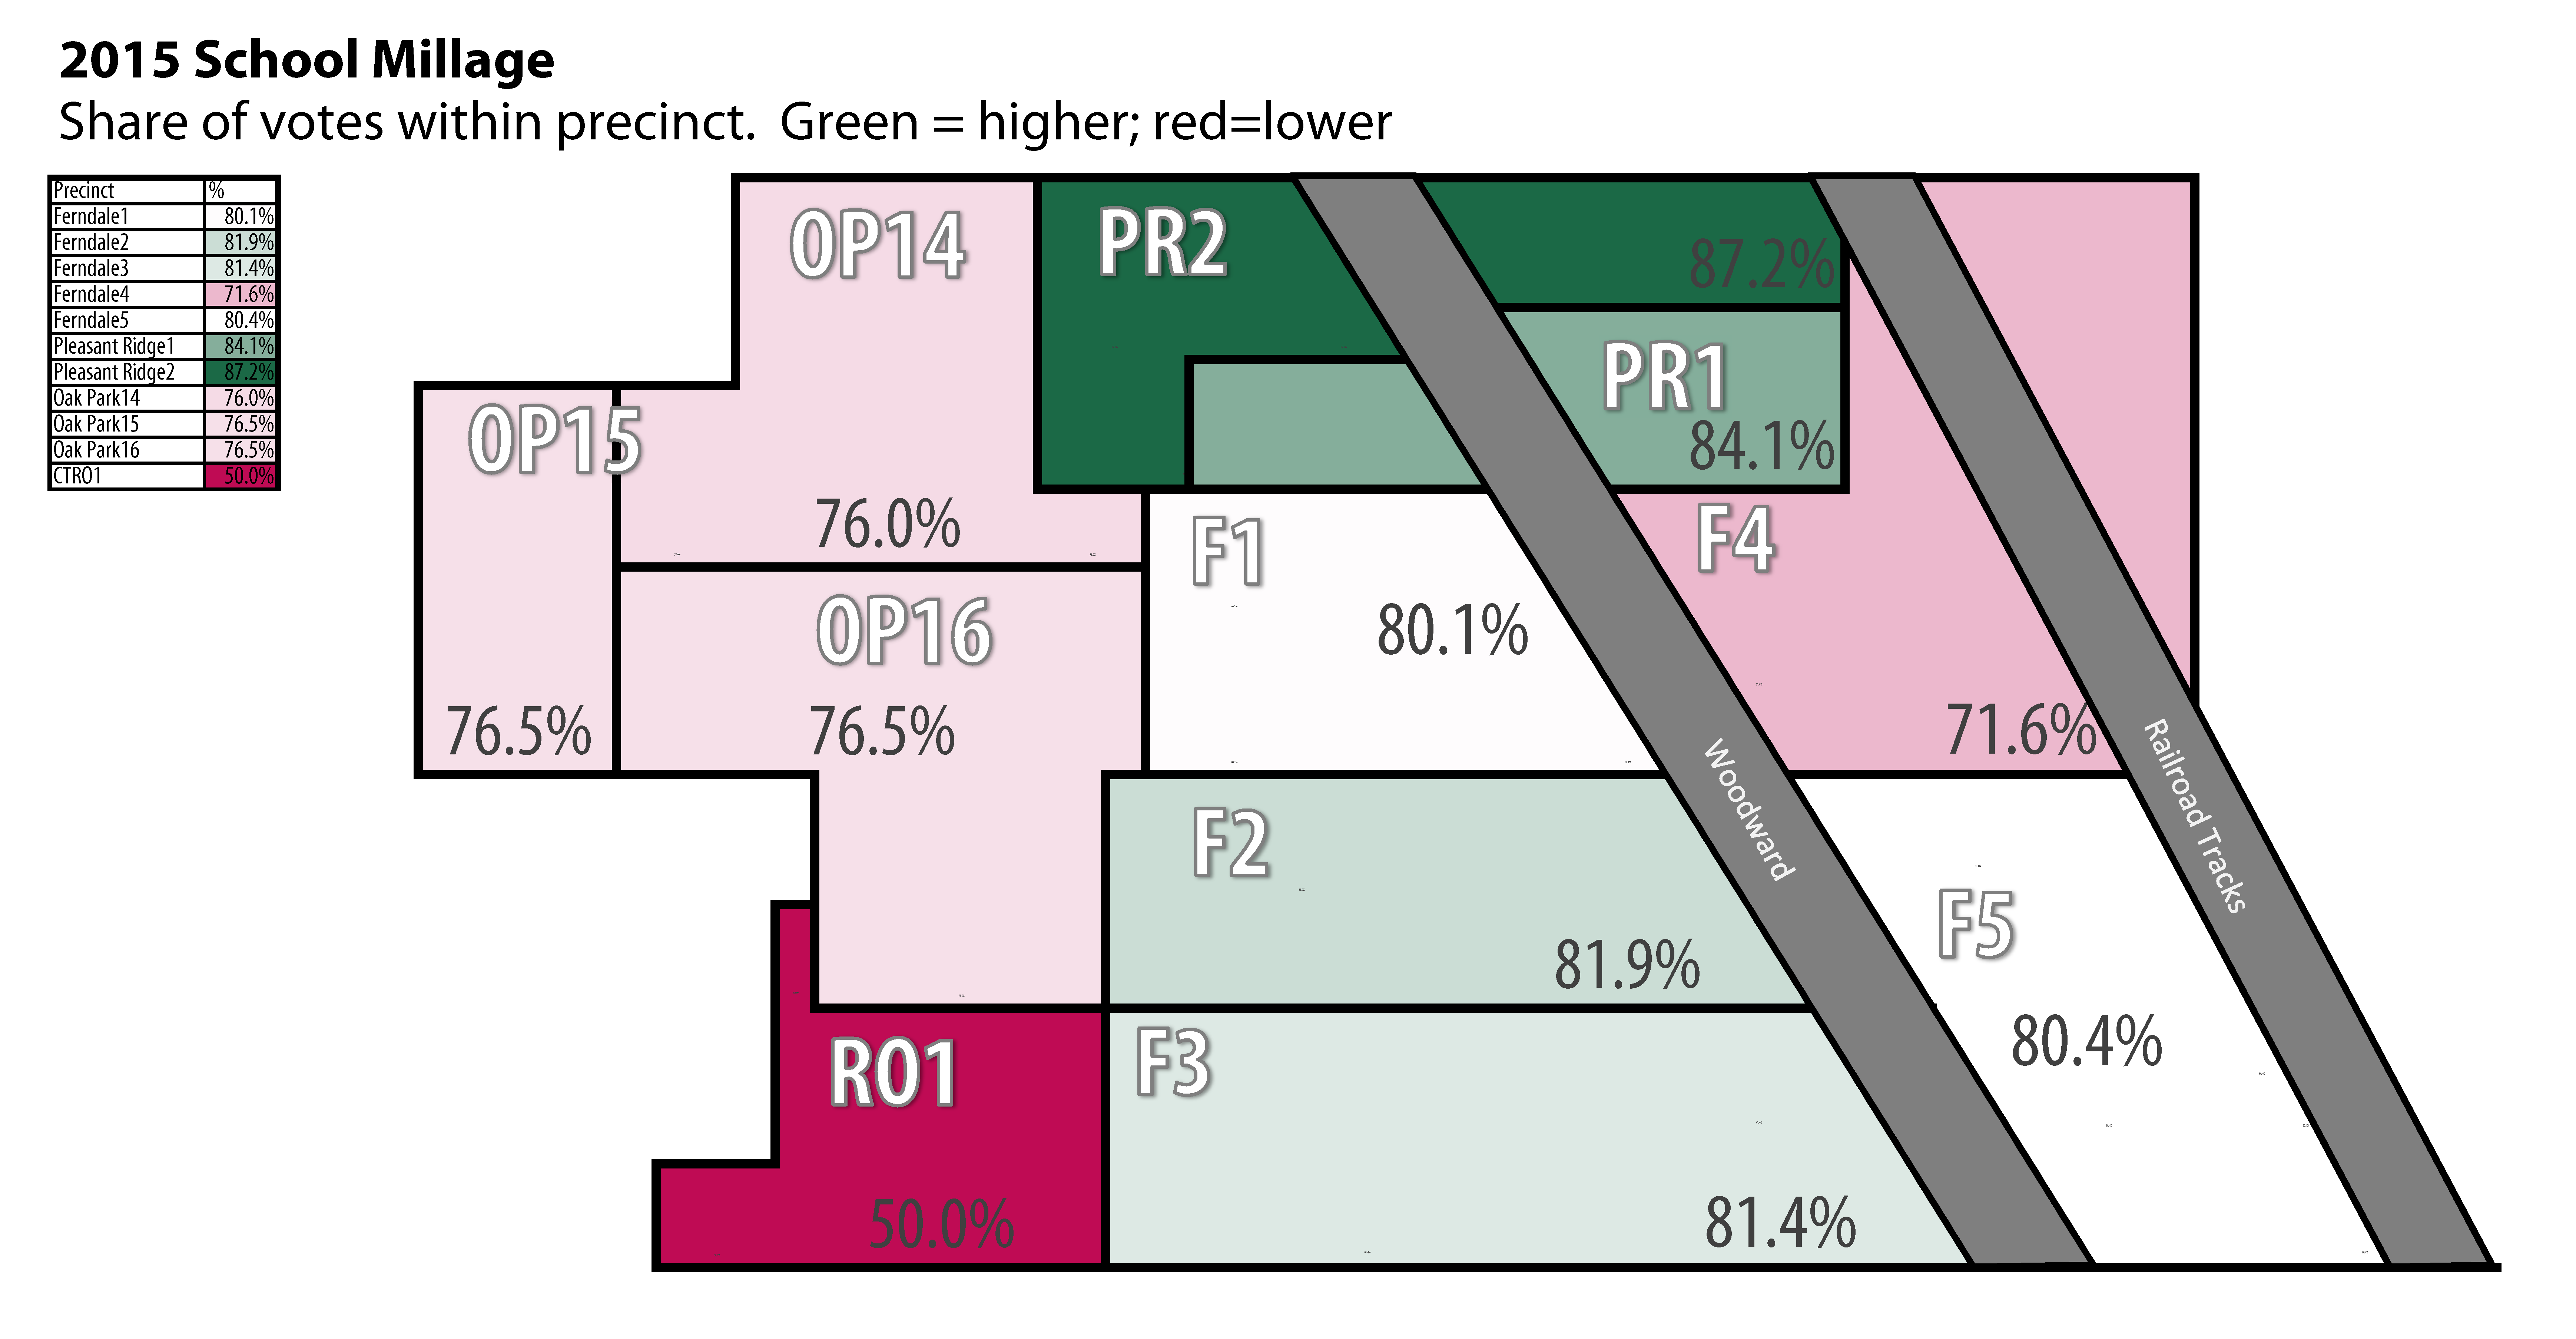 2015 Schools Non-Homestead Millage |
Overall, we see communities that are fairly stable in their preferences, and communities that, unless given a strong reason to think otherwise, tend to support millages for public goods. I am proud to live in that kind of community.