Slovakia Dashboard News: AZEN and the sound of one poll clapping

Almost a month ago, I reported doubts about the poll produced by the previously unknown pollster AVVM.  Last week, AVVM issued a new poll, but though it only increased my doubts, I decided not to report on it because even too-credulous (or circulation focused) Pravda described the results as “strange” (cudny) and a search of other major news outlets produce other stories worth responding to and trying to correct.  And yesterday an article in SME by Miroslav Kern (“Pre-election juggling with preferences“) dealt nicely with the issue in broader terms.  I try not to do what the Slovak press is already doing well (and despite my occasional criticism, there is a lot that they do well) and so I figured there was nothing to write about here.

And then, in a search for results of another idiosyncratic poll (Presov University, on which more later) I found myself on the website of Novy cas.

I generally do not read Novy cas, as it does not have a particularly serious reputation, but I realize now that I should read it more often, for a variety of reasons.  My first reaction to the Novy cas election website (after getting over my annoyance that it required me to download Microsoft Silverlight to even work) was “Wow.”  Not only does the website look great (waving Slovak flag and all) but it had a “Your Ideal Quiz” (because of Silverlight I can’t actually link to it but the page it is on is here: http://volby.cas.sk/) that actually asked pretty good questions, showed the result of each answer on the suitability of particular parties and, when I tried to make answers point to a certain party, actually increased the score for that party.  So far so good.

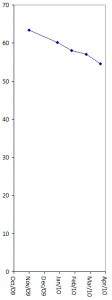
Novy cas also has lots of party information all in one place: tagged news stories, party list, party program (with an interesting mini-wordle that shows the most common word in the party’s program), and development of party preferences over time.  This last, however, raised some questions: it listed only one poll per week, but polls in Slovakia are not done on a weekly basis so the polls must come from different sources and so cannot be easily compared. It did not list the sources, so I had to reconstruct it by comparing the data to my own poll database.  The first of the four turned out to be FOCUS, the second Polis and the third and fourth…AVVM (a detail that Kern didn’t know or was too polite to mention).  Let me restate that in stronger terms:

The self-proclaimed “most read daily newspaper on the internet” is (without telling anybody) basing its election infographics on the product of an untested polling firm with polls that are highly problematic.

Spot the Problematic Poll

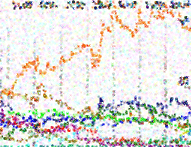
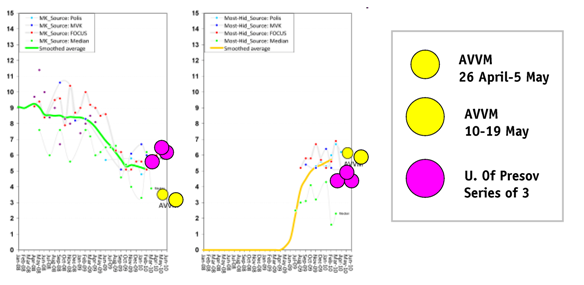
How do we know that AVVM is problematic.  In my previous post on AVVM’s first poll, I showed that the firm’s results were far from the median polling numbers of other firms or even from the overall range of those results.  The second AVVM poll does not change this assessment in any meaningful way, as the following eight graphs show (AVVM is in yellow; the Presov University poll that I discuss below is in pink):
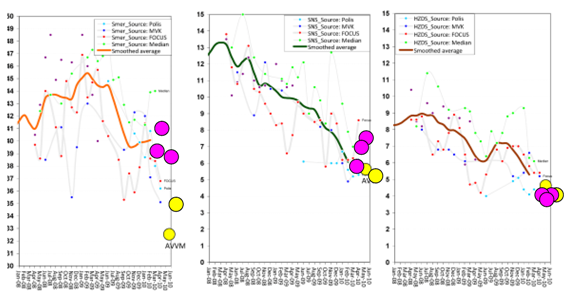
For the current government parties, AVVM’s second poll is not so out of line.  In its first poll AVVM produced exceptionally low results for Smer (orange), though by the second poll this had moved up (and other polls had moved down) until it lay in a more normal range.  Likewise AVVM is in the normal range for SNS and HZDS.
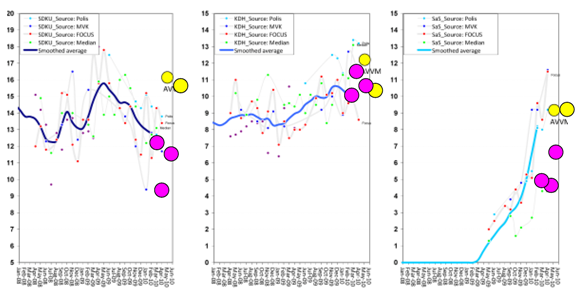
Among the Slovak opposition parties, AVVM produced fairly average results for SaS and KDH but quite high for SDKU.

It is for smaller parties that AVVM produces the oddest numbers (both in real and especially in percentage terms.  Most-Hid results are fairly average but numbers for SMK are exeptionally low–lower even than the low results produced by Median.

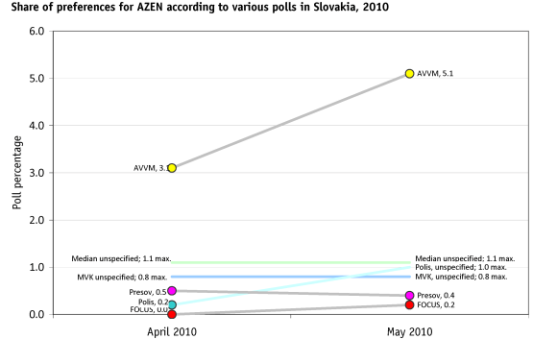
Of course the biggest variation from the norm, and the one that attracted Pravda‘s “strange” headline is the party’s results for AZEN, the new party formed by HZDS defectors Zdenka Kramplova and Milan Urbani.  I have not created a dashboard graph for this party because its numbers are actually so low that most polling firms do not report it.  To compensate for the lack of full data, I’ve created an approximation graph which gives AZEN the benefit of the doubt (assuming that it just barely misses the threshold for reporting).  Even giving it the benefit of the doubt, the results are striking:

AVVM results for AZEN are so far from the norm of the other four major firms (and from the Presov University poll as well) that they simply cannot be taken seriously.  It may be that AVVM is right and the others are wrong, but nothing in my experience would suggest that to be the case.

Furthermore, the explanations for this divergence given to SME by AVVM director Martin Palásek are so bad as to disqualify the firm from any further consideration:

  • The first explanation: “the party is first on the alphabetical list of parties” and may therefore draw additional support (To prove I’m not making this up: “Konateľ AVVM Martin Palásek výsledok AZEN vysvetľuje najmä tým, že sú prví v abecede, a tak ich uvádzali aj na anketových lístkoch”.)  If AVVM hasn’t figured out some way to control for this then either a) its polls do not deserved to be published anywhere or b) I will be able to win a significant share of Slovakia’s vote simply by registering a new party under the name “Aardvark Alliance”
  • The second explanation: Party chair Urbani “is among the most popular HZDS politicians” (“ponúkol tvrdenie, že Urbáni patril k populárnym politikom HZDS“).  This is in some ways even worse as it reveals a willingness to follow conventional wisdom rather than the hard data which is the only currency of pollsters (except of course that they accept money from parties to do polls).   In fact my I cannot find any evidence that Urbani has ever appeared among the lists of “most trusted” politicians conducted regularly by MVK, even though these sometimes contain as many as 30 names.  So much for AVVM.

Spot the Ambitious (but Still Problematic) Poll

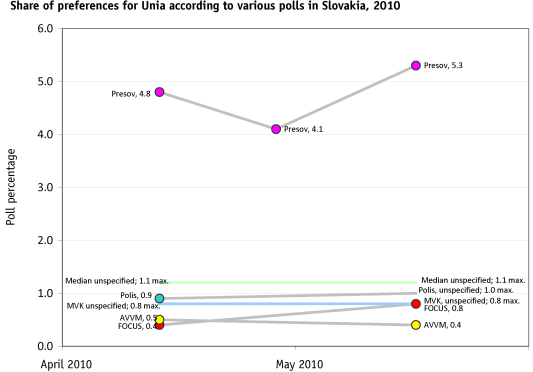
In the same general category as AVVM but with important specific differences are the polls conducted by university students at Presov University.  These are fairly consistent with the other polls: just a bit high for Smer and SMK, a bit low for HZDS and SDKU and Most-Hid.  For three parties the Presov numbers are further from the norm: low but moving in the right direction for SaS, high and moving in the wrong direction for SNS and shockingly high for Unia.  For those who have forgotten, Unia is a merger of three economic and cultural liberal parties: Slobodne Forum (SF), which split from SDKU in the 2004, Civic Candidates (OK) which split from SDKU in 2008 (I think), and Liga -Civic Liberal Party (Liga-OLS) founded in 2008 by former officials of SDKU and ANO.  Merging three parties with extremely low preferences into a single party and then adopting an entirely new name seems in retrospect to have been poor tactics as since its formation Unia has regularly polled less than the previous totals for its component parties.  Except in the Presov University polls, as the graph below shows:

As with AVVM on AZEN, it is hard to take the Presov University numbers seriously on Unia since they are so far out of line even giving the party the benefit of the doubt on polls where its results are not reported.

It is hard to be as critical of this effort as it is of AVVM, first because it has not been used by a major newspaper without any effort to mention problems or discriminate among its strengths and weaknesses (though that is more the fault of Novy cas than AVVM itself), and second because from everything I can find out about it, it is a laudible educational effort that is open about its methodological limits, cites the geographical areas in which the poll-takers worked, and openly discusses its choice of question and the rationale for it.  I am still not sure that I understand how they actually went about the questioning or whether their decision to use party leader names rather than party names is a good way to measure preferences, but at least they are trying something new and explaining why they are trying it.  For that I give them great credit, even if I don’t feel like I can include their poll results in my overall average.

Guest Blogger: Tim Haughton on Slovak Electoral Politics, Part I

More from wide-ranging Tim Haughton, who this time sacrificed dry feet to bring a full report of Tuesday’s political campaigning in Slovakia and showed his political acumen and intrepidity by going not to Bratislava, where everybody goes, but rather to Kosice.

How to Win Votes and Influence People – Some Reflections from Slovakia

Tim Haughton, University of Birmingham

It’s a question which excites and perplexes scholars and practioners alike: what kind of campaigning really works? How best can a political party spend its time and money to attract and hang on to the support of voters?

With the Czech vote behind us, I decide to head to the other half of the federation, where as all readers of this blog know, the Slovaks are gearing up for their elections. Opening the curtains of the sleeper carriage as the train pulls into Kosice station, I am greeted by the beaming smile of Vladimir Meciar, the three-time prime minister of Slovakia. His billboard promises ‘hovorit Pravdu, dat Pracu a urobit Poriadok’ [speak the truth, create jobs and ensure order].

The three Ps are capitalized, reminding me of Public Private Partnerships. Critics of Meciar’s time as prime minister (and indeed his party’s participation in the current government) might suggest that such PPP arrangements are about taking from the state to give to those near and dear to his party. A lucrative and successful partnership for some, but not for the coffers of the Slovak state. As readers of this blog know, Meciar’s People’s Party-Movement for a Democratic Slovakia (LS-HZDS), once Slovakia’s most successful electoral machine is in danger of falling below the 5% threshold. Perhaps to counter the widespread view that the party is a group of silver and grey-haired Meciar devotees, another poster at Kosice station depicts a large group of smiling twentysomethings, declaring that ‘And the young vote LS-HZDS’. Somehow I’m not convinced we will see a rush of first time voters racing to the polling stations to cast their votes for Meciar. The major challenge for Meciar’s party is to convince voters that it makes sense to support the party on 12 June. The party may still have brand recognition and one of the iconic figures in Slovak politics, but it looks and feels like a party well beyond its shelf-life which seems to have lost its raison d’etre.

The area around the station is full of billboards. Amongst those of the centre-right Slovak Democratic and Christian Union – Democratic Party (SDKU-DS) and the Christian Democratic Movement (KDH) are several of the Slovak National Party (SNS). SNS’s pitch to voters is to pluck at xenophobic and nationalist heart strings. Whilst one of the billboards declares the party’s desire to ensure ‘that our borders remain our borders’ (a clear criticism of the big neighbour to the south), another wants to ensure ‘we don’t feed those who don’t want to work’ underneath a picture of a large, heavily tattooed Roma. Given Presov’s large Roma minority, this is a poster which sadly might be quite effective.

On arriving at the station I endulge in my usual ritual of buying a range of different newspapers. The leading Slovak paper, Sme, is running a story on the recent TV clash between Prime Minister Robert Fico and the head of the SDKU-DS electoral list, Iveta Radicova. It doesn’t make happy reading for the latter (the majority thought Fico had won), but I wonder how much influence these duels really have. Having watched both British and Czech ‘prime ministerial debates’ in recent weeks, I’m reminded that they can generate plenty of press coverage, can seem to have changed the political landscape, but ultimately – in the British case in particular – may have had little impact. In the Czech case if they had any impact it may have been to persuade some undecided voters not to vote for either Necas or Paroubek.

Elsewhere the papers are full of comments reflecting on the impact of the Czech results on the Slovak elections, most of which miss the key factors. For my money, three points are worth stressing. Firstly, electoral thresholds matter and can consign an evergreen (no not the greens, but KDU-CSL) to life outside parliament. The fact that nothing is sacred and that even long-standing parties with seemingly loyal support bases can fail, is a lesson some Slovak parties will need to take on board. Secondly, CSSD’s disappointing result and Paroubek’s departure must have had a sobering effect on Fico. The combative party leader was Fico’s closest international partner who enthusiastically backed Fico in the 2006 election. He has been more than just a political ally as Fico’s attendance at Paroubek’s wedding (in the role of a witness if memory serves correctly) highlights. Thirdly, it has given a filip to the centre-right. ‘If it possible for the assorted forces of the right to defeat what they like to label “lefist populism” in the Czech Republic, then why not here’ , they proclaim?

After checking into my Kosice hotel I head back to the station to take the train to Presov. After having bought my ticket to Presov and a ticket for the sleeper back to Prague, I notice on the back of the ticket to Presov an SNS advert replete with a picture of the old-new party leader Jan Slota and his one-time successor and now predecessor as party leader Anna Belousovova. Moreover, on the back of the ticket sleeve for my ticket and sleeper reservation is an advert for Bela Bugar’s Most-HID party. These both strike me as clever strategies on the part of the parties. Unlike other campaigning materials voters are given, a train ticket is not heading straight for the rubbish bin and perhaps will be looked at more than one during the journey. Smer-SD activists have also been at work. The slow train from Kosice to Presov may not be a glamourous place to campaign, but a party supporter has clearly been hard at work and has left campaign literature material on each of the little tables next to the windows.

The desire to visit Presov is dictated not by a desire to leave Kosice, but to attend an SDKU-DS political meeting where all the party’s stars and wannbe bigwigs are scheduled to attend. Thanks to the inclement weather the outdoor meeting doesn’t begin as planned at 16:00, nonetheless, campaigning doesn’t stop. Decked out in blue waterproofs young activists distribute party material and in a clever touch reminding Slovaks that their team will play in the World Cup starting in a few days time, they give out a red card like the one used by football referees reminding voters to give Fico a ‘red card’ at the election. It is also fascinating to observe how the different politicians behave. Many of the less well-known politicians use the opportunity to circulate and give the waiting crowd their own electoral material. Thanks to the open lists, the possibility of preference voting means that it is important for these candidates not just to encourage citizens to vote for the party, but they need to plug themselves as well, especially if they are well down on the party list. Whatever the merits of such big rallies for the parties as a whole, they are valuable opportunities for wannabe parliamentarians.

Once the meeting starts it follows a clear script designed to build-up to a climax, blending music and speeches. The best speech of the night is given by former PM Mikulas Dzurinda. If a party funding scandal hadn’t forced him to step down as leader of the party list, he would be the most likely alternative to Fico as PM. Dzurinda delivers his five minute speech with gusto, reminding the audience of his governments’ successes, berating Fico for his mistakes, pointing to the success of the centre-right in the Czech Republic and imploring the good citizens of Presov to get out and vote on 12 June.

Tony Blair’s press guru Alistair Campbell and the spinmeister supreme Peter Mandelson were always keen on making sure all the details are correct, acutely aware of the importance of image and symbols. The SDKU-DS leadership, however, have clearly not studied the New Labour handbook. Indeed, I’m surprised by the little slip-ups in SDKU-DS’s otherwise well-presented (and apart from the late start) slick rally. Two of the slips are made by the two bands providing the music. One plays the riff from Bowie and Queen’s ‘Under pressure’ as they warm up. Well, maybe only I noticed that, but during the performance one band plays Bryan Adams’ ‘the summer of 69’. I’m not sure how many of the audience were paying that much attention, but surely a song which describes 1969 as the ‘best days of my life’ isn’t really an appropriate one in the former Czechslovakia. It might have been the ‘best days of my life’ if one’s name was Gustav Husak, but post-68 Czechoslovakia under normalization wasn’t for most Slovaks.

The other attention to detail seemingly missed by the organizers was the exact location of the stand. Whilst it is opposite one of the busiest bus stops in the city and a Tesco supermarket, it is right in front of the town’s main theatre where they are showing a performance of ‘Marie Antoinette’. As I see former finance minister Ivan Miklos and social affairs minister Ludovit Kanik (who introduced the tough neo-liberal welfare reforms during the last SDKU-DS-led government) standing next to the stage all I can think of is the former French Queen’s infamous line to the masses of Paris ‘Let them eat cake’. Perhaps I am reading to much into these observations, but anyone with a good camera and video recorder could at least use the images to poke some fun at SDKU-DS.

By the time Iveta Radicova speaks it is already over two and a half hours since the event was supposed to start and the rain has been almost unceasing. The water has seeped through the fabric of my shoes and has made my feet all wet. After a few words from the woman who could be prime minister in a few weeks time, all of the party candidates assemble on stage for the grand finale> a rousing rendition of the campaign song ‘Modra je dobra’ (‘Blue is Good’). It’s a great song, originally recorded by the Czech band ‘Zluty pes’, but after so long standing in the rain with soaking socks all I think about is that maybe ‘Modra je dobra, ale mokra nie je’.

Czech Election Update: Getting it wrong

No time right now for fancy graphs but since the Czech election produced a result that was not predicted by the polls (the best pre-election scenario was a narrow center right majority if KDU-CSL made it into parliament,  whereas what we appear to get is a substantial center right majority even without KDU-CSL) I want to make a quick post of the data on results and polls for 2010 and, for comparison’s sake, for 2006 (thanks to STEM which posted a similar analysis in that year, largely because their numbers looked the best).

Quick conclusions from this data:

  • The Impact of Firm. Factum and CVVM did best in terms of raw numbers in 2010 while Factum and SANEP did best in percentage terms.  Stem, which the best of the major players in 2006 by a wide margin, finished in the middle of the pack this year.  Median, about which I have written elsewhere, did very well on the two largest parties, but was so wrong on the others that it finished last in both percentage and raw stats.  (To badly paraphrase Marshall McLuhan the [problem with] Median is the method).   The overall range, however, was quite narrow: between 19.4 points and 23.4 points.
  • The Impact of Time. Everybody did badly this election compared to last time.  Factum maintained about the same performance in 2010 as in 2006 but its relatively poor performance in 2006 was good enough for first or second place (depending on the measure) in 2010.  Part of this, though, depends on the number of parties in the sample.  Limit it to just the three long-standing parties and the difference between polls and reality for 2010 is not that different from 2006; similarly, the average of percentage difference (raw difference divided by party’s actual score) is also only slightly worse in 2010 than in 2006.
  • The Impact of Party. The biggest single differences between polls and reality were for CSSD (6.7 points less) and TOP09 (5.5 points more), with all of the rest falling into a narrow range between 1.1 and 1.9.  In percentage terms, however, it was SPO and SZ whose results were most at odds with the polls (+43% and -48% respectively), followed closely by TOP09 (+33%) and CSSD (-30%).
  • The Asymmetry of Error. While 2006 had its share of non-predictive polls, 2010 is notable for the ways in which the polls did not correspond to the actual parliamentary (and presumably governmental) outcomes in the way that differences accumulated on the two main sides of the political spectrum.  In 2006 poll predictions averaged 3.0 points lower than actual results for CSSD but this was counteracted by polls that were on average 3.5 points higher than actual results for KSCM.  In 2010, by contrasts, the difference between polls and reality tended to enhance the difference: results were 6.7 points lower than polls for CSSD and 1.9 points lower than polls for KSCM (they were 1.9 points higher than average for SPO, but this provided no compensation in seats because SPO failed to enter parliament.  On the right, there was some compensation but not much: results were 1.1 points lower than polls for KDU-CSL and 1.7 points for ODS, but these were more than outweighed by results that were 5.5 points higher than polls for TOP09 and 1.5 points higher for VV.  The result was a 10.9 point difference in favor of the right in 2010 compared to 4 points in 2006 (9.8 to 1 if SZ is counted as right).
    This was more than enough to compensate for the loss of all seats belonging to KDU-CSL and still give the center-right a significant majority of votes and, especially, seats in parliament.
2010 Actual Factum CVVM STEM Median SANEP SC&C Average Absolute difference Factum CVVM STEM Median SANEP SC&C Average
CSSD 22.1 -4.2 -8.4 -8.8 -4.1 -7.8 6.7 -19% -38% -40% -19% -35% 30%
ODS 20.2 -2.7 1.2 -1.2 1.2 -2.1 1.7 -13% 6% -6% 6% -10% 8%
TOP09 16.7 5.8 2.7 6.3 6.0 6.6 5.5 35% 16% 38% 36% 39% 33%
KDU-CSL 4.4 -1.1 0.9 -0.1 -3.1 -0.3 1.1 -25% 20% -2% -71% -7% 25%
KSCM 11.3 -1.8 -1.7 -2.2 -2.0 -1.6 1.9 -16% -15% -20% -18% -14% 17%
SPO 4.3 1.7 2.3 1.7 -2.5 -1.2 1.9 40% 54% 39% -57% -27% 43%
SZ 2.3 -0.3 -2.2 -1.2 -1.2 -0.6 1.1 -13% -95% -53% -52% -26% 48%
VV 10.9 -1.7 -0.6 0.7 3.3 1.1 1.5 -16% -6% 7% 30% 10% 14%
Sum of absolute difference for all Major Parties 19.4 20.0 22.1 23.4 21.3 21.2 22% 31% 25% 36% 21% 27%
Sum of absolute difference ODS, CSSD, KSCM 8.7 11.3 12.1 7.3 11.5 10.2 16% 20% 22% 14% 20% 18%
2006 Actual Factum CVVM STEM Median SANEP SC&C Average Absolute difference Factum CVVM STEM Median SANEP S-C&C Average
ODS 35.4 7.6 3.4 2.2 -0.2 4.4 21% 10% 6% -1% 12%
CSSD 32.3 3.8 4.3 0.9 4.3 3.0 12% 13% 3% 13% 9%
KSCM 12.8 -4.5 -2.7 -3.4 -1.2 -3.5 -35% -21% -27% -9% 28%
KDU-CSL 7.2 -1.8 1.7 0.4 0.5 0.1 -25% 24% 6% 7% 18%
SZ 6.3 -2.3 -4.2 -2.5 -3.6 -3.0 -37% -67% -40% -57% 48%
Sum of absolute difference for all Major Parties 20.0 16.3 9.4 9.8 13.9 26% 27% 16% 17% 23%
Sum of absolute difference ODS, CSSD, KSCM 15.9 10.4 6.5 5.7 9.6 23% 15% 12% 8% 16%

d

Czech Dashboard News: Final Factum Poll and Coalition Math

Only three days to go and we have now the final allowed-by-law pre-election poll numbers in (the big three of CVVM, STEM and Factum-Invenio; SANEP and Median did not report, but this is probably all right since I am not yet certain how to think about SANEP and I am certain that Median has significant problems).  And the result is….

Well the average of the big three is CSSD 29, ODS 21, Communists at 13, TOP09 and VV at 11 and KDU-CSL just under 5%.  But Factum’s poll puts CSSD at 26, ODS at 23 and KDU-CSL just over 5%.   As I’ll discuss in a moment, this makes a big difference.  But first a schadenfreude interlude.

I have been reporting for a very long time about the insufficiencies of Slovakia’s reporting on public opinion polls, particularly the tendency to treat each new poll as an utterly independent news item without any regard for previous polls by the same firm or contemporary polls by other firms.  As somebody who has frequently championed equality of status between Slovakia and the Czech Republic, I am happy to report the otherwise sad news that Czech reporters are just as limited as their Slovak counterparts. Dnes reports “Left has lost its majority, ODS strengthened” but ODS improved by a mere 1.2% (well within any margin of error for such a poll, though of course the story did not mention any margin of error) and by my estimation of seats, the left has not had a majority in the Factum poll since February, so it’s only in comparison to other polls that the left lost ground.  But of course that’s not the right comparison to make. To be fair a better Dnes article published twelve hours later interviews the directors of the three major firms and uses their responses to compare the major polls, how they ask questions and why they differ.  It also does a good job of looking at the consequences of the elections.  But this is not an excuse, I think, for bad reporting of the results on the fly.  It does not take a conversation with Kunstat, Hartl and Herzmann to have a sense of why polls differ or why an article should not report on more recent polls as if they are more accurate polls.

The mid-range parties are actually quite consistent in the polls, with KSCM around 13%, occupying an incredibly small range from 13.0% to 13.5%, while for the other parties the range is a bit wider: VV is around 11%, ranging from 10.2% to 12.6%, and TOP is around 12% with a wider range, from 10.4% to 14%.   But the more important differences are at the top and bottom of the party scale.

At the top, CSSD produces two quite different sets of numbers–CVVM and STEM put it around 31% while Factum puts it at 26%–while ODS produces an equally large but more evenly distributed range of responses: Factum puts it a 23%, STEM at 21% and CVVM at 19%.  In percentage terms these differences are not much bigger than those for VV or TOP, but in actual terms these differences are large enough to be crucial for determining the composition of the next government.  At the bottom of the spectrum there is a small difference in the results for KDU-CSL–3.5 in CVVM, 4.5 in STEM and 5.5 in Factum–but a difference with extremely significant results.  Not only does this difference of 2 percentage points represent about 50% of KDU’s average result, but it also means the difference between life and death for the party and perhaps for the coalition.

Given the significance of these two sets of numbers–they Are responsible for the difference between the “Left has majority” and “Left lost majority” headlines–it is time to do what the Czech daily press simply has not done (if any magazines or blogs have done it, I would like very much to hear about them), which is to examine the underlying math.  To do this is more complicated than I would like.

Ebb and Flow of Voters, Czech Republic, 2006-2010. Click here for larger image.

Unlike Slovakia, where a single district makes calculation of seats from votes a simple exercise (which Markiza still managed to get wrong in 2006), the Czech Republic’s combination of many, differently sized districts and parties with varied regional strengths makes a quick estimation impossible.  The best data, of course, would be a fairly significant sample size within each region, but since I don’t have that (and neither do most pollsters) or even a too-small sample size in each region, I am forced to rely on the large but dated data source of the last election.  If parties’ regional strengths are consistent over time (and Kostolecky’s work suggests that they are), then we can guess what overall numbers mean for particular regions and calculate seat results on that basis.  Of course we don’t have historical data for new parties and so I have made a guess that VV will have the same regional strengths and weaknesses as the Czech Greens in 2006 and that TOP09’s regional distribution will be an equal mix of ODS and KDU-CSL.  Those aren’t great guesses but they do at least correspond to the ebb and flow charts a recent Dnes article (see right).  I have no idea if this will work.  We will see in a few days when I can plug in the electoral numbers and see if the 2006 regional distributions predicted those of 2010.

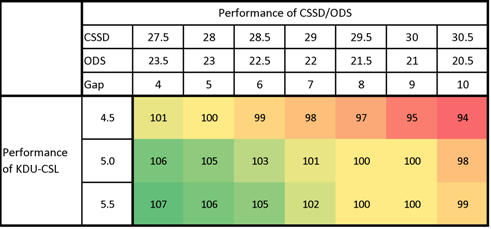
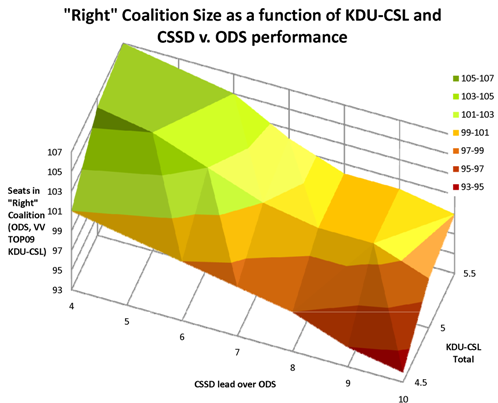
That done,  we can then test various other assumptions, namely the relative performance of CSSD and ODS and whether KDU-CSL makes it over the threshold.  The outcome is not unexpected but it is useful to take a look at the data which I present here in two formats:  a color table and (because I can and have always wanted to) in a piece of (hard to read and pointlessly flashy) topography.

The simple take on this is that if KDU-CSL and ODS do well, there’s a strong possibility of a right wing government with a slight majority; if they do not do well, then they won’t be able to form a government and we’ll be in some odd realm of CSSD-led government where they key will be whether KSCM provides the (silent) supporting votes or one or more of the new parties fills that role.

More interesting are the other combinations: ODS does well but not KDU; KDU does well but not ODS.  In the first case, it would appear that KDU in parliament is equal to a three point swing between CSSD and ODS.  In other words, KDU brings as many seats as would a shift in the CSSD:ODS ratio from 29:21 to 27.5:23.5 (from a 7 point gap to a 4 point gap, which is about the same as the difference between Factum and STEM).  As the experts relate in the aforementioned Dnes article, if KDU falls short, then a majority right wing government will require ODS to outperform all but the most favorable polls vis-a-vis CSSD and for TOP09 and VV to maintain their current levels.  If KDU succeeds, then a narrow majority government becomes possible even with the ODS-negative results offered by STEM and CVVM.

Perhaps most remarkable result here is the renewed chance of deadlock of both CSSD and KDU do well: the amber “plain of indecision” on the graph above.  It is remarkable that in the middle of the Czech Republic’s greatest period of volatility since 1992, one marked by the emergence of two new parties and the probable death of at least one other, the outcome in the middle of the possibility graphs is yet another 50-50 split, yet more deadlock.

Dashboard News: What to make of Median (again)

The final April poll is out in Slovakia and because it is “Median” it is more or less what we might expect, which is to say that for the parties whose numbers are most interesting, Median’s numbers are utterly unreliable.  Actually in technical social science terms they are quite reliable in that they “measure the same way each time” and almost certainly invalid in that, at least from the perspective of somebody who is interested in how people will actually vote they are almost assuredly not a good “approximation to the truth or falsity of a given inference, proposition or conclusion” (For more on the differences, see http://www.socialresearchmethods.net/tutorial/Colosi/lcolosi2.htm).  In other words–and this is much the fault of the Slovak media as it is of Median–DON’T RUN STORIES ABOUT WHO WILL GET INTO PARLIAMENT OR NOT USING MEDIAN DATA.

(For a prime example, see SME prieskum-medianu-nepustil-do-parlamentu-smk-a-most-hid.html, though the headline does at least specify that the poll is from Median, which is a warning to more informed readers.  Slightly less irresponsible, but rather odd is the TA3 headline, PRIESKUM: Keby boli voľby v apríli, vyhral by ich Smer-SD which emphasizes that Smer “would win” despite the fact that this is the one thing everybody does know and that the Median data for this month actually shows the largest single drop in support for Smer of any Median poll I can find.)

So what can we make of Median’s numbers.  In the spirit of Stephen Stucker, we can still make something.  Median’s trendlines are not usually out of line with the rest of the parties.  So here’s what we learn.

In Median’s poll Smer shows an enormous drop–almost six points.  This comes after two months of Smer numbers in Median that were unusually high and bucked the trendline of the other polls, so this is probably simply a return closer to the norm for Median on Smer and brings it in line with the other polls, though it is worth noting that Median always polls high for Smer (with the exception of only two months in the last year it has produced the highest numbers for Smer, usually between 3 and 4 points above the average of the other three polls).  So Median confirms Smer’s drop but doesn’t tell us how far, though around 36 or 37 looks like a good current guess.

SNS shows a big rise in Median’s numbers, one that pulls it back to January levels.  The curve is almost exactly the same–though a bit higher–as that of FOCUS, suggesting that the FOCUS number is more than just statistical noise and that SNS may have actually benefitted from the Fidesz victory in Hungary.  Only Polis showed no SNS bounce in April and so we can probably take the bounce seriously and perhaps move SNS slightly higher in its probability of passing the threshold, though its long-term trend is still resolutely negative.

Median is the only poll to give HZDS a bounce in April–the other three show stability or a slight drop.  In this case it may be the Median trend that is out of line.  As with Smer and SNS, Median consistently polls high for HZDS and so its claims on all three of these need to be discounted a bit.

Current coalition parties overall.  It is notable that even though Median tends to poll high for the coalition parties, and does so again this month, the overall trend (small graph at the right) shows an unbroken drop in total coalition preferences over the last 5 months by about 9 points overall (A disclaimer: it matters where you begin your trendine.  Carry this graph back two months and it appears that January was actually an unusually high peak compared to the months before or after.  But carry it back 6 months and the trend of decline re-emerges quite distinctly.)

For SDKU the situation is muddled.  Median polls very high for SDKU this month, but it does not always do so, suggesting that the party may have shown an increase.  The evidence from the other polls is mixed: Polis also shows an increase, though not as big as the one in Median; MVK and FOCUS show slight decreases.  This is one party without clear trends at the moment.  It appears to be holding steady between 13 and 14.

Like both MVK and Polis, Median shows a drop for KDH but from the highest level the party has ever received in a Median poll.  FOCUS also showed a drop for KDH (but from a much lower baseline).  Here we have significant disagreement, with FOCUS pulling the lower end and MVK near the higher with the two less established polls both showing higher.  It is hard to say what this means. I will have to think about it.

This is the first Median poll to show SaS above the 5% threshold, but Median has consistently polled very low for SaS (as do all new and small parties), and what is important here is that the party shows the same almost unbroken upward trend and degree of increase in Median as in every other major poll.  The party will fall back some degree when voters are in the booth, but it is hard to imagine it falling so far short that it misses the threshold.

The overall rise for the “right” parties is almost perfectly reciprocal to the decline of the coalition, a steady increase of 6 points since November and more from the summer of 2009.  This conforms quite well to the findings of every other poll.

Median has a big Hungarian problem. About 11% of Slovakia’s population is Hungarian and past elections show that the Hungarian parties/coalitions together receive about the same percentage of the vote.  Yet only three times in the last year has Median’s total of preferences for Hungarian parties exceeded 8% and five times (including this month) it has been below 7% (this month the two sum to 6%).  This suggests a major problem with Median’s methodology or its network or both and so it is hard to give credit to its numbers for Hungarian parties or its trends.  For the record this month shows a slight drop for MKP-SMK and a slight increase for Most-Hid but these likely mean little and they certainly do not merit the SME headline mentioned above.

From my college era I remember a slogan (likely propagated by beer companies to prevent excesses that would hurt their PR and inspire anti-drinking legislation), “If you must drink, drink wisely.”  A note to SME (and Pravda and TA3 and all the others:

If you must cite Median, cite Median wisely.

Polls, Politics and Parties, Part 6: How (not) to second guess the polls…

Two-and-a-half months ago I finished up a blog post on poll predictiveness with a cliffhanger:
This question has driven experts to find a variety of proxy measures to figure out how to adjust polling numbers to reflect the final outcomes.  This post is already too long, however, so that will have to wait for another post.

By now readers have no doubt forgotten that they have been hanging on in suspense and have moved on to other important things, but I have not forgotten the promise.  Indeed I could not since this is one of the two biggest questions that shape how we look at poll numbers in Slovakia (the other is the threshold, which I will deal with in the next part of this series) and since the issue has surfaced in nearly every major Slovak daily.  No refer to just a few:

Each of these articles refers to methods by which one might try to put poll numbers in context, with the ultimate goal, the grail, to make a better prediction of election results.  On the one hand some articles, such as the most recent one from SME, say that this can’t really be done–that it depends too much on idiosyncratic behaviors and random events.  Other articles, such as the one in Hospodarske Noviny suggest that the firmness of voter commitment might offer some clues that would allow us to make better predictions.  Others have suggested factors such as voter turnout likelihood, measured either by surveys or by past polls.  Recent trends may also play a role in shaping how people decide when they actually enter the voting booth.  These all seem plausible, but rather than take any of these potential influences as real, it is worth testing them to see if they do have any relationship to the difference between polls and actually election outcomes.

The Role of Voter Loyalty

It seems quite plausible to assume that for two otherwise identical parties, the party whose voters are more committed to voting for it will perform better.  It seems plausible, the,  that polls (which usually don’t ask about degree of committment) will tend to underestimate the election-day performance of parties with more committed voters.  And this should give us a tool for making better predictions.

But it doesn’t.

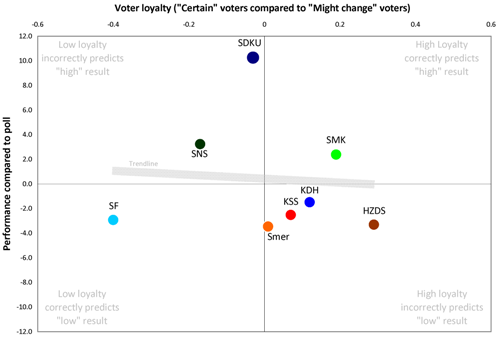
At least it didn’t in 2006.  Below is the first in a series of graphs that looks at the relationship between potential sources of “poll adjustment,” such as “voter committment,” on the x- or horizontal-axis and the actual predictiveness of polls (specifically the difference between election results and poll results) on the y- or vertical-axis.  If a source of adjustment is useful, the graph should follow a straight line between lower left and upper right (in other words, parties which score “low” on whatever factor also underperform polls while parties that score high overperform polls).

The graph for “voter loyalty” (measured here as the difference in a March FOCUS poll between those supporters of a party who say they will “definitely” vote for the party and those who say they “might change” their minds) suggest that this data source does not allow us to improve our assessments.

In fact, there is a slightly negative relationship between loyalty and support.  The factor of loyalty might help explain why the longstanding SMK did better than expected and why the relatively new and weak SF did worse (which, if true, might suggest a discounting of current preferences for SaS), but it does not explain the overperformance of SDKU (except to the extent that SF voters may have shifted to that party, something not factored into the “loyalty” question).  More to the point, perhaps, it also does not explain the underperformance of HZDS, which in 2006 had the most loyal voters of all.  “Committment” may have something to do with it, but if it does, the interaction is too complicated for this single piece of information to produce any meaningful insights.  So HN may be right in pointing out that KDH voters are the most “solid” but that does not help much.

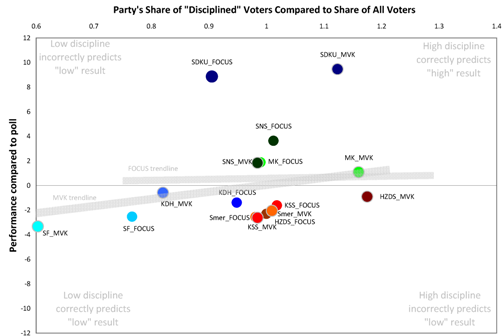
A related factor–perhaps very closely related–was cited by ING Bank in its own quite thorough 2006 analysis of the prospective election results which circulated before the elections.  The bank’s report, which unfortunately did not contain full footnotes, cited two measures of voter “discipline” and compared the share of “disciplined” voters committed parties to the share of voters overall.  Here again, a party with more “disciplined voters” should in theory have a better chance of outperforming the polls than a party with fewer disciplined voters.  Unfortunately, I do not know how they defined “disciplined” and I have a feeling that it is simply another way of calculating the same “loyalty” data above.  Since I don’t know whether it means anything, I analyze the results here only to demonstrate that the same results emerge for polls by both FOCUS and MVK (and therefore that this is not simply an artifact of FOCUS polling).

The trendlines here are essentially flat, suggesting no relationship.  The MVK results have a slightly positive trend, but not by much and the overall pattern is murky: again it works for SF and, with MVK, for SMK and SDKU but not for SDKU in the FOCUS survey or HZDS in the MVK survey.

The Role of Party-Voter Turnout

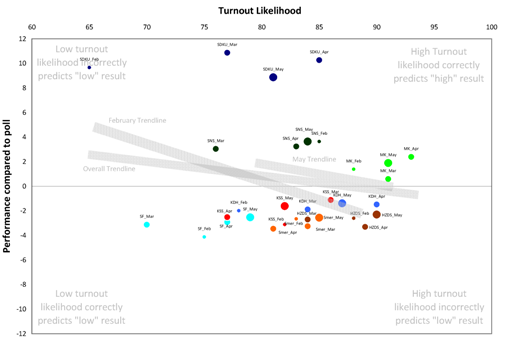
The voting decision is actually twofold: alongside the question of whom to vote for is the question of whether to vote at all.  The preference question itself does not measure whether those who prefer a party will actually make it to the polls on election day.    In theory those parties with voters who were more likely to go out and vote would do better than others and therefour outperform the polls.  We have data on this because in 2006 the pre-election FOCUS polls regularly asked about likelihood of participation.   The graph below combines the results for all major parties over four months and shows the relationship-line for the February data, the May data and the data for all four months aggregated together.

As with the loyalty data, the trendlines here point down, suggesting that knowing the likelihood of voter turnout for a party does not help figure out whether the party will perform better than the polls.  This figure works for the same parties as loyalty–SMK in the positive, SF in the negative–and fails for the same parties as loyalty–SDKU and SNS  outperform likely turnout while HZDS underperforms.  Of course there may be a reciprocal relationship here between SDKU and SF and between SNS and HZDS, but the point here is that the loyalty and turnout figures alone do not tell us that information and cannot be used to specify our predictions.

Previous Polls

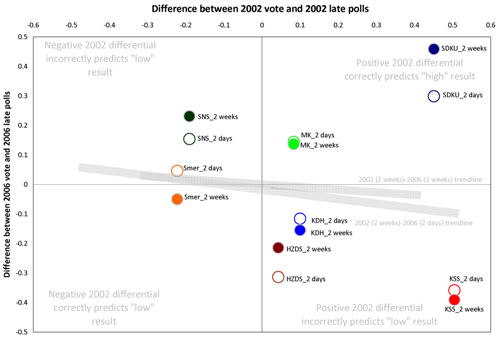
An even more direct way to estimate the overperformance or underperformance of parties compared to polls is to look at the performance in the previous election.  In 2006 I set out to create a prediction model based largely on this principle, looking at the gap between past polls and past actual results using the 2002 Slovakia parliamentary election and 2004 Europarliament election and suggesting a relationship between differences in turnout (medium in 2002, very low in 2006) and differences between party polls and party performance.   The model did not work.  Or more precisely, it worked so idiosyncratically that it was not useful:  it worked well for SDKU and SF and badly for most of the rest.  The graph below demonstrates the weakness of that attempt: the

The graph shows two sets of dots because there is a slight comparability problem:  in 2002 the law forbade polls within the last two weeks of elections whereas in 2006 it did not.  The graph above shows differences between polls and results as a percentage of the poll figures in 2002 compared to 2006 for both the 2006 polls taken immediately before the election (white circles and colored rims) and those taken in a more comparable 2-4 week period before election (colored circles and gray rims).  In both cases, the results are the same:  predictiveness of polls in 2002 did not help assess predictiveness in 2006 except for SDKU, SMK and Smer (but only the 2 week prediction and  not the election day prediction).  It would appear that too many other variables affect the parties and polls over time for this method to work well.

What we need, then, is some kind of indicator that itself incorporates a significant share of the factors that shape poll predictiveness.

Oddsmakers and Experts

One way of assembling and integrating relevant factors is to find a smart and trustworthy person who has already done it.  It is even better if the person (unlike the author of this blog) stands to lose some tangible resources if the predictions are wrong.  There are not many public sources for this kind of information for Slovakia.  Political scientists, pollsters and journalists (precisely because they do have something to lose–reputation and perhaps even revenue) tend to keep their predictions to themselves.  And there is not yet a widespread public odds market in which individual buying and selling of shares offers a glimpse into public assessment of probabilities (a mechanism which has been extremely effective in predicting close races in the United States) except in SME‘s ambitious effort, which at least for now does not seem to involve real losses or gains or a particularly large base of participants (though that does not mean that the collective wisdom of SME‘s readers won’t be correct, and the consensus I see there is not implausible) .

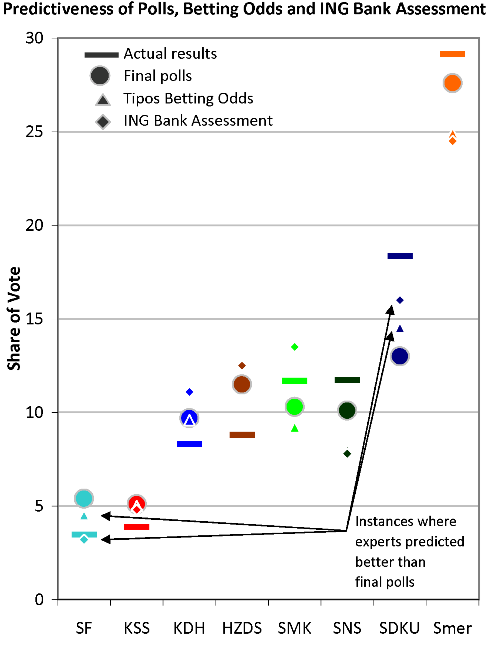
What we have instead are two rather thin reeds: in 2006 the firm Tipos.sk allowed public betting on election questions, though the odds were established by the bookmakers themselves and only occasionally updated rather than in a true shares market (and which can be reverse-engineered into an assessment of the bookmaker’s own predicition); and in that same year an assessment by an analyst at ING Bank became public (though not necessarily with the encouragement of the bank).  I am sure there are other analyses floating around by political risk mangement firms, but I don’t have access to them (though if readers do and can share them, even for past elections, I would be extremely grateful).  The question is whether these expert opinions do much better than the raw data.  The answer is no, as the chart and graph below show.  In only 4 cases out of 16 did the expert opinion do better than the actual final polls in predicting the outcome (and in this cases for the likely suspects:  SF, with its weak base, and SDKU with its past history of significant underestimation) while in 7 of 16 cases the expert opinion did rather worse than the actual data.  Of course these analyses emerged more than a month before the actual election and, to be fair, they actually performed slightly better than the poll estimates from May polls, so experts do have their (slight in this case) value for those needing their predictions well in advance.

Party Actual 2006
election result
Actual results minus pre-election estimates
Final week
poll average

Tipos odds

ING Bank

HZDS 8.8 -2.7 -3.8 -3.7
KDH 8.3 -1.4 -1.3 -2.8
KSS 3.9 -1.2 -1.1 -0.9
SDKU 18.4 5.4 3.8 2.4
SF 3.5 -1.9 -1.0 0.3
Smer 29.1 1.5 4.2 4.6
SMK 11.7 1.4 2.5 -1.8
SNS 11.7 1.6 3.7 3.9
Average error in raw points 2.1 2.7 2.6
Average percentage error 21.7% 25.7% 22.5%

The best tool I can find: Pre-election trends

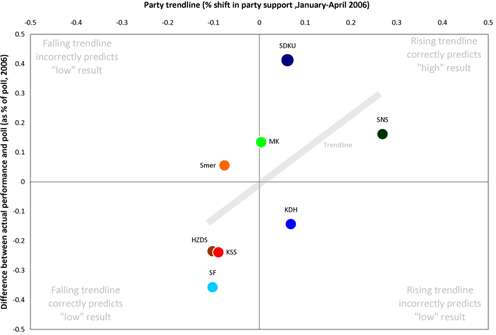
In the process of testing all of these various mechanisms for prediction, I decided to try one last method:  does a party’s trajectory actually affect its final outcome?  In this case the theory suggests it should not have much of an effect:  when polls are taken up to the last minute, then trends themselves should not shape the final decision.  It is possible, however, that a voters’ sense of trend might bring a reluctance to vote for a declining party or an enhanced willingness to vote for one on the rise.  And lo, when I ran the numbers the results came out shockingly clear:  in 2006 a party’s trendline for January through April had a clear relationship to the party’s tendency to over- or underperform polls:

This source of information correctly predicts 5 of the 8 and incorrectly predicts only 2 (and then only by narrow margins).  The dots are grouped tightly around the line, suggesting a strong relationship.  It is as if the election results followed the trendlines, but at levels they would have produced in July or August rather than June; the experience of going into the voting booth may force the kind of concentration that pushes voters to become the extrapolation of trends.

A strong caveat: I am hesitant to take this too far, especially since I have not been able to put together a time series for previous elections or in other countries, but the initial results suggest that the past trend is something worth attending to.

A word about prediction, caveat be damned. So what would this flawed (but not as flawed as the other methods I’ve looked at here) say about Slovakia’s upcoming 2010 election?  Well it is necessary to begin by looking at the 2010 four-month trends.  There are, of course, several ways to calculate the trend, averaging individual poll trends or aggregating all poll data together.  The results and relative positions of parties are reasonably similar, however.  The following table gives the range:

Party Trend Change
SaS Significantly positive +60% to +80%
KDH Moderately positive +10% to +13%
SMK Slightly positive +7% to +11%
MOST Slightly positive +2% to +8%
SNS Mixed -5% to +8%
SDKU Flat 0% to +1%
Smer Moderately negative -10% to -12%
HZDS Significantly negative -10% to -23%

This is good news for SaS (especially since if the question of “loyalty” and “discipline” are relevant anywhere it is for new parties such as SaS whose positive trend here may be enough for it to overcome the at-the-polls reluctance that kept SF from parliament in 2006) and not bad news for KDH, though this party seems locked into a 9.5%±1.5% performance zone regardless of external circumstances.  The news Smer is not good–but this is not unexpected, since the even party elites know that their party gathered a significant amount of soft support during its more successful years–but not catastrophic since Smer has a huge lead over the next largest party.  The worst news is for HZDS which has both the strongest negative trend in recent months and the least cushion to offset any losses.  If the trendline factor found in 2006 applies in 2010 then HZDS will not make it into parliament.  A big if.

For the other parties the prediction is far less clear.

  • I suspect this model does not apply at all to Most-Hid and SMK since the intra-ethnic competition takes a quite different form.  Of course this makes all of the above assessments rather useless since this is what everybody wants to know.
  • For SDKU the neutral trend is probably about right.  In the past the party has benefitted from last minute decisions by voters to stick with the tried and true on the right.  With a revived KDH and a solid alternative in SaS (barring any mistakes by the party or revelations about it in the next month), SDKU will likely not see the big jump that it saw in 2006 or 2002.  Its has a good chance of being the strongest of the right-wing parties, but probably not by too great a margin.
  • As for SNS, it is an open question.  In the last four months, SNS saw a general decline offset by a major rise in a single poll: FOCUS in April.  Take out that one data point and SNS shows a trend in the last four months that matches its sharp decline over the past full year.  It is for that reason that I am keen to see the April Median poll–not for level but for trend–and especially the May FOCUS trend.  If FOCUS in May puts SNS back under 6% then the party may be in real trouble.  The threshold will have a big impact on the shape the next government (the topic for the next post, I hope.)

Dashboard News, February 2010: MVK shows Coalition Down

A new report from the polling firm MVK (the only company I know without a web address or logo) puts the current coalition down almost 5 points and the current opposition up by 6.  Here’s the poll:  http://spravy.pravda.sk/mvk-zostava-smer-hzds-a-sns-by-po-volbach-nezlozila-novu-vladu-pbp-/sk_domace.asp?c=A100309_094511_sk_domace_p12 .  But does it fit what we know from other polls?  More or less.

Coalition
As the dashboard shows, MVK’s numbers are within a plausible range nearly all parties.

  • Smer:  MVK shows a nearly 5% drop between mid-January and late February which seems rather large.  The other two polls we have (FOCUS and Polis) show the party with a slight recovery rather than a major drop during the same month, though MVK’s results did come late, however, and  it’s possible that something happened (not clear what that would be from the news) to reduce Smer support in a way that isn’t recorded yet in the other polls.
  • SNS: MVK shows a smaller loss for SNS but in some ways a more significant one because as far as I can tell from my records it is the first major poll since August 2004 to show SNS below the threshold.  Whether SNS is really that low is an open question (and one openly disputed by SNS which regards this poll as yet another election tactic by its opponents) but it is clear that every major poll has shown SNS down in recent months and the MVK poll certainly fits the trendline. Of course the party have low numbers because voters do not want to admit voting for it (this seems to have happened for HZDS during the 1990’s) but it could also have something to do with the party’s frequent scandals. Political commentators in Slovakia have argued that the party is immune to scandal because of its national message but that has struck me as rather condescending to nationalist voters. The fate of SNS will be–both for coalition development and for the overall tone of Slovakia’s politics–one of the most important questions in the coming election.
  • HZDS: MVK shows the party up a bit which is actually likely if SNS is really down. If one of these parties drops, the other is likely to be a minor beneficiary. It is fascinating, however, that the combined vote total for these parties is now down to around 10%-11%. Just two years ago the combined total averaged around 19%-20% in MVK polls.

Opposition
Most of these numbers, too, seem plausible though there is a bounce here that seems slightly unlikely:

  • SDKU: The poll shows this party up more than three points from last month which seems unlikely during a period of scandal, but last month was an exceptionally low month for SDKU in MVK and this merely returns the party to its levels for late 2009. Since the low poll came before the scandal and this more recent poll has come after (but before Radicova’s election), this would seem to offer some confirmatory evidence that the scandal did not hurt SDKU too badly, which makes some sense and gives some credit to Dzurinda for leaving the electoral list and more or less taking the scandal away with him.
  • KDH: The party’s 12.7 is the highest total (by a two point margin) that the party has received my 8 years of records of MVK polls. If SDKU were down this would make more sense to me, but it is hard to see this as anything other than a blip, even for a party that is doing better than it had in the past.
  • SaS: Is the same as last month suggesting that 1) the party has some staying power and 2) that the growth may be over. If this is SaS’s peak (and I have no way of knowing or thinking that it is) we now need to watch to see if the pre-electoral slide of new parties which hit ZRS, ANO, SOP and HZD will hit SaS and whethe it is enough. It is good for SaS that they are starting the slide from a relatively high point–at 9.2 they can lose nearly half and stay above the threshold–but not so good that there are 3 months in which to do it.
  • MKP-SMK and Most-Hid. Both are down slightly from last month’s MVK and Most-Hid is near the threshold of viability by these standards. I have no way of evaluating what the right level is; other polls have tended to put Most-Hid above SMK in recent months so MVK is different but not to be discounted for that reason. The real question is whether one of these two parties begins to fall short of 5% whether voters will flock to the other. The worst case scenario for Hungarians (short of both parties falling short of 5% which I still think is unlikely) is for one of these two parties to get nearly but not quite 5%. Right now the numbers make that a strong possibility. This means we have a 50%-50% chance of the best and worst-case scenarios (both in v. one weak party in) as opposed to a much stronger chance of a middle-of-the-road scenario (one marginally stronger party in, one weak party out).

Finally, a plea: Would MVK please include full results in its press releases as FOCUS and Median do. Perhaps it would help if journalists demanded them.