Dashboard News, March 2010: Stability despite overblown headlines; the importance of thresholds

No time to do a thorough post right now but a Polis came out yesterday and FOCUS came out today. Click the Dashboard above for the graphs.  Here are few thoughts:

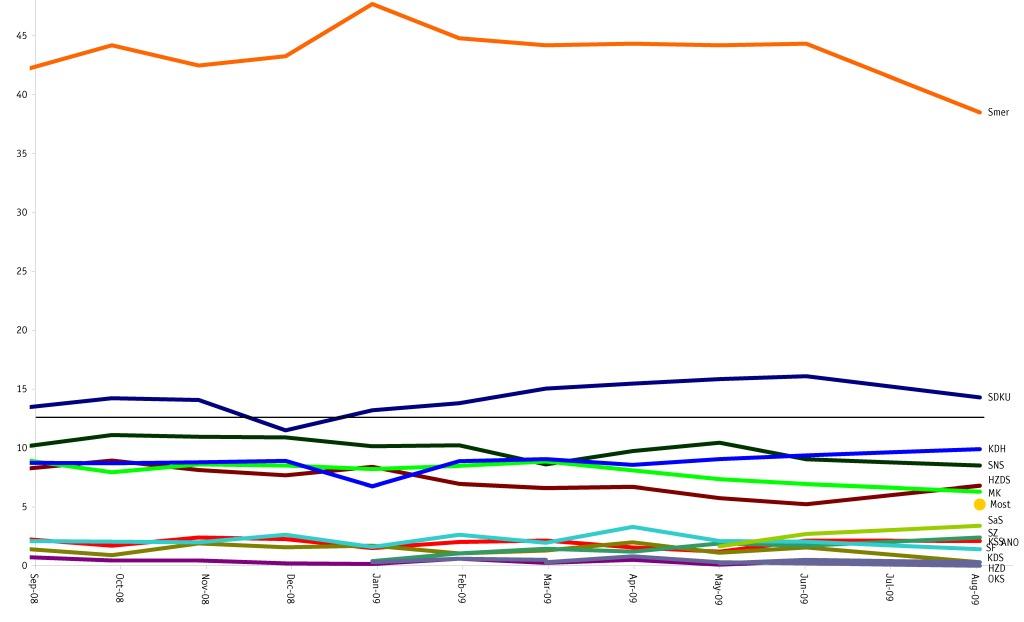
  • Smer.  Both polls show the party slightly down but not by much.  The party has averaged between 38 and 41 for the last 6 months.  It is now on the low side of that but there are no signs of either a precipitous drop or a recovery.  Of course it will all depend on the likelihood of the “soft” Smer voters (of whom there are probably quite many) to go and vote.
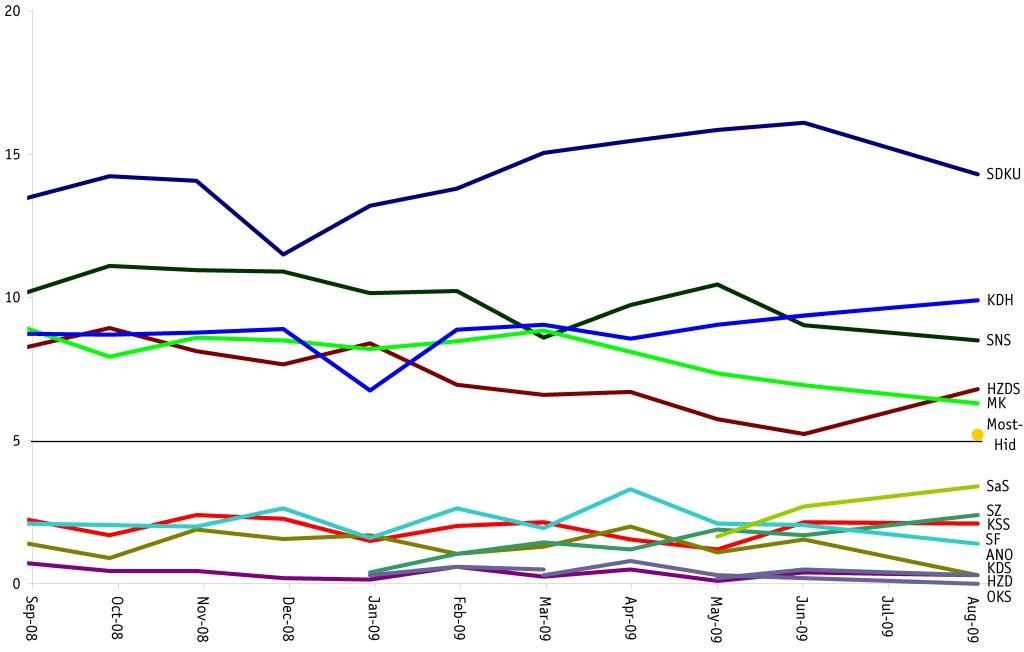
  • SNS.  Polis shows a further drop to just above the threshold (but Polis has usually polled low for SNS compared to the others).  FOCUS shows it holding steady around 6%.  It probably does hang just above the threshold and its future may depend on an unlikely combination of Orban and Meciar.  We all know Orban is going to win but the tone of the campaign could help SNS a bit; if Meciar begins to fall repeatedly below the threshold, some voters might also shift to the next nearest “national” party, which is SNS.  There is still some degree of reciprocity between the voters of these parties, as with KDH and SDKU.
  • HZDS. Polis again shows it below the threshold, but Polis has usually polled low for HZDS.  FOCUS shows it with 5.2, the firm’s lowest result for the party since summer of last year.  Together these produce an average of 4.9 and so HZDS does not appear on this month’s roster of parliamentary parties.  Of course the upcoming Median survey will put the HZDS average back above the threshold, so there will not appear to be much of a change, but HZDS is clearly on the brink, and a drop like that of summer 2009 (and from a lower starting point) could knock the party out, especially if the April and May polls show it low and a few voters start to balk.
  • SDKU. Polis shows a drop from a high point; FOCUS shows a rise from a low point.  It is somewhere between 13% and 15%.  FOCUS, in particular, has shown a yo-yo, alternating between over 14 and under 12 since Fall.  Of course SDKU has been a bit of a yo-yo, with scandal followed by recovery.  Next month will help show whether the recovery shown by FOCUS is a “Radicova” bonus or just noise.
  • KDH.  In typical fashion the headline writer at the paper SME trumpeted KDH surpassing SDKU (along with a picture of Dzurinda pulling out a chair for Figel–they have pictures of elites interacting that serve every possible combination of events), but of course it probably doesn’t mean anything.  Polis puts KDH at a record high (and SDKU a bit low).  FOCUS puts KDH slightly higher.  Since FOCUS tends to poll slightly low for KDH and Polis tends to poll slightly high, the story–not one worthy of headlines–is KDH slightly up.
  • SaS.  Very little SaS news this month but that in itself is news:  FOCUS and Polis both show the party slightly down from last month, suggesting that Feburary may have been its peak.  A pre-election peak is a natural near-inevitability and is assisted by the election of Radicova to head the SDKU campaign during this period.  Watch what happens next here.   From the party’s position, the good news is that its peak and the resulting visibility is fairly high, permitting the party to sustain some losses.
  • Most-Hid and MKP-SMK. Both FOCUS and Polis show both parties slightly up, which seems unlikely in reality but which may be noise or a reaction to Hungarian-Slovak disputes.  In any case, MKP-SMK stands rather close to the threshold–too close for its comfort, I’m sure–but holds the organizational base, while Most-Hid stands higher but with a weaker voting base.  Either (but probably not both) could fall below the threshold… which brings me to a final thought.

The Importance of Thresholds.
As is to be expected these days, the Pravda headline writer announced yesterday, “Yet another poll shows opposition victory; HZDS remains below the line.”  And that is correct, as far as it goes.  The problem is “yet another” in this case means “yet another from the same polling firm” which is less surprising and that this firm has traditionally polled low for HZDS.  This is not to say that HZDS is not in trouble, but the lack of analysis is, as usual, unfortunate.  The really interesting point here–one which I do not blame newspaper writers for covering just yet–is that many parties are near the threshold and a .1% difference may shape Slovakia’s next government.  This month is an example.  The opposition and coalition are balanced closely enough that if one party from either side falls below (and there are two parties on each side near the line), it could mean victory for the other.  In the Polis poll dramatized by Pravda, it is HZDS that has fallen below, meaning that its seats get redistributed and Smer loses a partner, pushing it narrowly below the line.  Were HZDS 0.6% higher (7 more respondents in the poll), HZDS would stay above the threshold and the current coalition remains intact.  Such a small difference is not detectable by polls (even if we could get a perfectly representative sample and perfectly predict turnout behavior, it is still well within the margin of error).

It is also worth noting that an equally slight difference in SMK would put that party below the threshold and make it impossible for an “opposition” government, even if HZDS also fell below.

I hope to post more on threshold math in the near future.  Some preliminary calculations appear near the end of the Slovak Politics in a Nutshell post.

Polls, Politics and Parties, Part 4: Poll Predictiveness by Party, Pollster and Time

p16How well do public opinion polls in Slovakia predict election outcomes?  Well as the previous post suggests, not too well.  But they’re all we’ve got.  Of course we could always wait until the future comes to us, but, frankly, where’s the fun in that.  So rather than sit around and wait or make faulty predictions, we can try to figure out where and when the data we do have is most useful.  We can get a bit more mileage out of the data if we understand its strengths and limitations on three dimensions: time period, pollster and party   (It is theoretically possible to go further and divide it by categories within the surveyed population, but that requires the original data which is available only for limited periods and certain pollsters and so I will hold off on that for the moment.)  It is no surprise that recent data is better than old data, but even that generalization has its limits.  And while we can’t assume that polls will err in the future in the same way as in the past, it is important to know where the diversion between poll and reality crept in.

Time: Polls get better closer to elections.  Sort of.

As we elections near, shouldn’t polls become more predictive?  Yes, but not in a purely linear fashion.  I do not have a lot of data on this–only 3 elections, two of which were for the European parliament–but what I do have suggests that increases in predictiveness really only begins about 6 months before the election.  The graph below shows the differences in raw percentage points between poll “predictions” and actual results extending backward from election day.

Predictiveness of average poll results or major parties, approaching election

Predictiveness of average poll results or major parties, approaching election

There is quite a bit in these finding are news to me:

  • Improvement is not linear. I did not expect the “reversal” that occurs between one and two years out in each case–such that in each elections predictions made about 500 days before the election would be better than those made 200 days before the election.  Of course it is impossible to predict on what day to make the best predictions (for Slovakia’s parliament in 2006, T-500 days was better than T-700 or T-200, but this was not true for the 2009 Euroelections.
  • Europarliament predictions do not get better over time; Slovak parliament predictions do. Nor did I expect, though I should have, that predictions in Europarliament elections actually don’t get any better over time.  This is clearly related, I think, to the low voter turnout in Euroelections.  In this case the polls are considerably more representative than the elections themselves.  The results for Slovakia’s parliament, by contrast, have plateaus and valleys but do get closer to actual results with time.  (And one small footnote:  I worried that the results above were the result of differences in polling patterns: Slovak parliamentary elections have more polls and might therefore be more accurate.  But when I re-ran the numbers with only a single polling firm–UVVM–I got essentially the same results, suggesting that the patterns do not depend on the polling density).
  • Sharp increases in predictiveness come in the last 150 days. For two of the three polls, the best increase in accuracy came in the final five months and since today we are at entering month 4, we are already in that period.  Using these models (a rather thin basis for comparison) we could guess that we are just leaving the period of relatively low predictability and so any judgments made on the basis of polls to date should be taken with some care.  By a month out, we can make guesses about the final result that are not overwhelmingly different from the final rush of polls.  That’s not true today.

Pollster: Some firms are better than others, but not by too much

The second big question of accuracy depends on the pollster.  It may be that some firms are simply better than others and that to average them together is to inject unnecessary noise.  The graph below shows the errors in poll predictivness for each major polling firm’s final pre-election survey in four elections:  Slovakia’s parliament in 2002, Europarliament in 2004, Slovakia’s parliament in 2006 and Europarliament again in 2009.  Gray boxes mark “final” polls taken more than a month before the election.

Poll predictivness by pollster 2002-2009

Errors in poll predictivness by pollster 2002-2009

In this case the data–closer to the bottom means less error and more predictiveness–lends itself to several relatively clear conclusions (the full data set is at the bottom):

  • Slovakia’s parliamentary elections produce small differences. During parliamentary elections–the first and third clusters–all firms tend to cluster closely together with a very small difference among them.  These surveys tend to be large enough and carefully-enough framed, and with voters sufficiently politicized that the polls tend to converge around a single answer.   The only exceptions here–Median and FOCUS–are not exceptions at all since these (like Median in 2009) are polls taken a month previously and (as the previous section shows) a month makes a some degree of difference (about 0.5 or so).
  • Europarliament elections produce bigger differences. During Europarliament elections the spreads are much greater and the number of pollsters much smaller.  Here the differences among pollsters would matter (if Slovaks felt that the elections themselves actually mattered, which most appear not to do).

With regard to specific pollsters, two stand out, but they have either ceased their work in this or work quite infrequently:

  • UVVM was an excellent pollster and the decision by the Slovak Statistical Office not to continue these tests is a big loss.
  • OMV does good polls.  It’s a pity they only do them immediately before elections.  (As an aside, no matter how good its polls may be, they cannot be used as a substitute for exit polls, as STV tried to do in 2006.  Even the best, biggest pre-election poll seems destined to miss something).

Of the pollsters who still regularly poll (and with the exception of MVK, post results with increasing regularity) we can say the following”

  • FOCUS has done a mediocre job in parliamentary elections but an excellent job in Euroelections.   Without UVVM it is at the most reliable remaining pollster
  • MVK, by these same calculations has done slightly worse than FOCUS but it too remains fairly solid.
  • Median has not done as well and has been the high-end outlier in the two most recent elections (in 2009 its poll was taken a month before the election but its errant 2006 poll was taken in the final rush).  This may be the result of Median’s open-ended preference question that does not as closely resemble the ballot process.
  • The big surprise, and perhaps it is simply a coincidence, is that the telephone poll conducted by Polis in 2006 actually came close to the mark.  Telephone polls have faced considerable criticism in the past, including my own, but this one worked.  The 2010 election will provide a major test of its reliability.

Finally on the question of pollsters, it may be that no pollster is better overall but that some may be better or worse in detecting support for particular parties.  As the Dashboard shows to even a casual observer (and as I will try to analyze in greater depth nearer to the election), some parties tend to do consistently better in some polls than in others.  Does this translate into differences in electoral predictiveness?  Again we face here a lack of data but what we have yields several conclusions about past patterns, though these are not particularly useful predictors for the future as they reflect a difference of at most a few points from the results of other pollsters.  Nevertheless, we can say that compared to other pollsters,

  • UVVM’s estimates for SDKU in all elections are less than those of other pollsters and its estimates for SNS and KDH are less than those of other posters in parliamentary elections.  UVVM also overestimated HZDS in almost elections.
  • OMV has underestimated Smer in parliamentary elections and underestimated SNS and KSS in parliamentary elections
  • FOCUS has consistently underestimated HZDS and KDH, and has slightly overestimated Smer in parliamentary elections (while slightly underestimating the party in Europarliament elections).  It has also slightly overestimated KSS in parliamentary elections
  • Median has overestimated Smer in both elections for which we have its data and has underestimated SMK and HZDS and KDH (all rural parties, suggesting a weaker rural network of poll takers)
  • MVK has overestimated Smer and KDH in parliamentary elections and underestimated SNS and KSS.
  • With only one poll in, we have no way of making a broader assessment for Polis,  but I for one will be very interested to see what happens next.
  • Postscript: Just discovered this article about accuracy of presidential election results.  It corresponds roughly to parliamentary election results with reasonable results for FOCUS, MVK and, surprisingly, Polis.  See http://volby.sme.sk/c/4360649/statna-agentura-odhadla-vysledky-katastrofalne-a-facebook.html

Party: Some parties outrun the polls (sometimes)

The most interesting question is whether polls as a whole tend to over-estimate or underestimate the electoral support of particular parties.  This is a rather easy circumstance to imagine:  the networks of pollsters do not extend to the ethnic or class group in which a particular party is strong, or a particularly segments of a party’s support base are overwhelmingly less (or more) likely to actually get out to the polls.  The graph below lays out the differences between the averages of the final polls (white circles) and parties’ actual election results (color coded circles) for four elections: the parliamentary election in 2002, Europarliament in 2004, parliament again in 2006 and Europarliament again in 2009.  The arrows (thick for parliamentary, thin for Europarliament) point from the poll prediction to the actual result.

Poll predictivness in Slovakia 2002-2009

Only for a few parties do these arrows show clear patterns over time:

  • SDKU has been underestimated by polls all four times, though the gap has narrowed considerably.
  • SMK has also been underestimated, though by smaller amounts (and the gap in 2009 is the result of the emergence of Most-Hid which did not run candidates)

For several other parties patterns are less distinct:

  • KDH and HZDS have been underestimated in Euroelections but results in parliamentary elections produce no clear result.
  • For SNS there is likewise no clear pattern in parliamentary elections but a pattern of overestimation in Euroelections.

The biggest question, of course, is Smer, a party whose poll predictivness becomes an intensely political question.  The results here suggest:

  • A pattern of consistent overestimation in the polls by significant numerical (and even percentagewise) amounts in Euroelections and the 2002 parliamentary election…
  • BUT (and this is a very important but) in the well-polled 2006 parliamentary elections the polls actually slightly underestimated Smer’s performance.

The Smer problem here is simply a large-scale representation of the problem that we find here in trying to make predictions against a moving target (the relationship between party poll support and voter turnout) and with very little data (N=2 for each kind of election).  (Still, for those who are interested, I include the full data at the end of this post.)

This question has driven experts to find a variety of proxy measures to figure out how to adjust polling numbers to reflect the final outcomes.  This post is already too long, however, so that will have to wait for another post (and lest this seem like an unfair cliff-hanger, know that the efforts so far have not produced a particularly compelling answer).

Data Tables for the Obsessive (by the obsessive)

Election Party Major parties Smer SDKU SNS SMK HZDS KDH KSS HDZ ANO PSNS SDA SDL SF All Parties
2002
Slovakia
Average +2.0 +3.8 -4.7 +0.8 -0.9 -0.8 -0.8 -2.1 +2.0 +0.8 -0.5 +0.3 +0.6 +1.5
OMV-SRo +1.8 +2.3 -5.6 +1.6 -0.4 +1.0 -0.5 -1.2 +1.9 +0.3 -0.5 +0.6 +0.6 +1.4
UVVM +1.8 +1.7 -6.6 +0.3 -1.1 -0.8 -1.1 -1.4 +2.1 -0.2 -0.7 -0.4 +1.4 +1.5
Markant +2.0 +4.3 -4.2 +0.7 -2.3 +0.5 +0.4 -1.8 +1.1 +1.0 -0.4 +0.2 +0.6 +1.5
Dicio +2.1 +4.2 -2.8 +0.4 -0.8 -2.2 -1.4 -3.0 +2.8 +1.4 -0.6 -0.2 +0.2 +1.7
MVK +2.3 +5.0 -4.7 +0.4 -0.8 -1.9 +0.1 -3.5 +1.2 +1.0 -0.3 +0.8 +0.2 +1.7
FOCUS +2.3 +5.2 -4.6 +1.4 -0.1 -1.4 -2.3 -1.5 +2.8 +1.2 -0.6 +0.7 +0.8 +1.9
2004
Europarliament
Average +4.3 +9.0 -8.5 +1.8 -1.7 -0.9 -7.0 +1.1 +2.4 +0.5 -0.4 +3.5
FOCUS +3.0 +0.7 -7.9 -1.1 +0.4 -1.4 -8.4 -1.3 +3.2 +1.6 -0.4 +2.6
OVM +4.5 +8.5 -7.3 +3.4 -2.9 -1.6 -5.6 +2.0 +2.1 +0.6 +0.4 +3.3
UVVM +5.0 +13.3 -9.2 +2.7 -2.1 +1.0 -6.9 -0.1 +2.6 +0.1 +0.2 +3.8
Dicio +5.7 +13.4 -9.6 +2.4 -1.9 -1.5 -7.1 +4.0 +1.8 -0.3 -1.8 +4.4
2006
Slovakia
Average +2.2 -1.6 -5.3 -1.7 -1.4 +2.7 +1.4 +1.2 +0.7 +0.8 +2.6 +2.0
OVM-Sro +2.0 -2.4 -4.8 +0.1 -1.7 +1.5 +1.3 +2.0 +0.9 +1.3 +0.8 +1.7
Polis +2.2 -2.5 -4.7 -1.1 -0.4 +2.5 +3.3 +0.6 +1.4 +0.8 +0.3 +1.8
UVVM +2.2 -0.6 -5.7 -2.0 -1.4 +4.1 +0.6 +1.2 +1.7 +0.9 +1.1 +1.9
MVK +2.3 -1.1 -5.9 -1.7 -1.7 +2.7 +2.2 +1.1 -0.6 -1.4 +2.5 +2.1
Dicio +2.4 -1.1 -5.7 -3.5 -2.0 +2.7 -0.2 +1.2 +0.4 +2.7 +5.0 +2.5
FOCUS +3.2 +2.6 -8.9 -3.6 -1.9 +2.3 +1.4 +1.6 +1.6 +2.0 +2.5 +2.8
Median +3.4 +0.7 -10.6 -3.6 -3.2 +1.8 +1.1 +2.7 +3.5 +1.1 +5.5 +3.4
2009
Europarliament
Average +3.9 +11.9 -2.6 +5.0 -3.5 -2.2 -1.6 -0.2 -0.4 +3.6
FOCUS +3.3 +8.4 -1.2 +3.4 -2.7 -3.7 -2.6 +1.1 +0.8 +3.0
UVVM +3.6 +11.7 -4.5 +5.0 -2.8 -0.5 -0.3 -0.0 -0.4 +3.1
MVK +3.9 +11.0 -1.6 +4.8 -3.0 -2.9 -2.7 +1.0 +0.9 +3.5
Median +5.0 +15.8 -2.0 +6.5 -4.8 -2.6 -1.9 -1.7 -1.6 +4.6

dd

Party Parliamentary Election Year Poll Avg. Result Raw Poll Error % Poll Error Average Poll Error Consistency
Smer Slovakia 2002 17.3 13.5 3.8 28% 12% Mixed
2006 27.6 29.1 -1.5 -5%
EU 2004 25.9 16.9 9.0 53% 46% Consistently too high
2009 44.3 32.0 12.3 38%
SDKU Slovakia 2002 10.4 15.1 -4.7 -31% -30% Consistently too low
2006 13.0 18.4 -5.4 -29%
EU 2004 8.6 17.1 -8.5 -50% -27% Consistently too low
2009 16.1 17.0 -0.9 -5%
SNS Slovakia 2002 4.1 3.3 0.8 23% 5% Mixed
2006 10.1 11.7 -1.6 -14%
EU 2004 3.9 2.0 1.9 94% 79% Consistently too high
2009 9.1 5.6 3.5 64%
MK Slovakia 2002 10.3 11.2 -0.9 -8% -10% Consistently too low
2006 10.3 11.7 -1.4 -12%
EU 2004 11.6 13.2 -1.6 -12% -26% Consistently too low
2009 6.9 11.3 -4.4 -39%
HZDS Slovakia 2002 18.7 19.5 -0.8 -4% 13% Mixed
2006 11.5 8.8 2.7 31%
EU 2004 16.1 17.0 -0.9 -6% -24% Consistently too low
2009 5.2 9.0 -3.8 -42%
KDH Slovakia 2002 7.5 8.3 -0.8 -9% 4% Mixed
2006 9.7 8.3 1.4 17%
EU 2004 9.2 16.2 -7.0 -43% -28% Consistently too low
2009 9.4 10.9 -1.5 -14%
KSS Slovakia 2002 4.2 6.3 -2.1 -33% -1% Mixed
2006 5.1 3.9 1.2 31%
EU 2004 5.7 4.5 1.2 26% 29% Consistently too high
2009 2.2 1.7 0.6 33%
SF Slovakia 2006 5.4 3.5 1.9 56% 56% No data
EU 2004 2.9 3.3 -0.4 -11% 11% Mixed
2009 2.1 1.6 0.5 33%
HZD Slovakia 2002 5.3 3.3 2.0 61% 113% Consistently too high
2006 1.7 0.6 1.1 166%
EU 2004 4.1 1.7 2.4 143% 143% No average
ANO Slovakia 2002 8.8 8.0 0.8 10% 53% Consistently too high
2006 2.8 1.4 1.4 97%
EU 2004 5.2 4.7 0.6 12% 12% No average

Dashboard News: Telling the Wrong Story in the Slovak Press

Dashboard NewsSometimes it pays to stop and think before sitting down to write.  Every major Slovak daily yesterday reported on the results of the February poll by the firm FOCUS.  And every one told the same story.

Unfortunately, that story is wrong in two significant ways.

  • First, the decline of SDKU started long before Smer attacks. As the data shows (http://www.la.wayne.edu/polisci/timeplot/skp_sdku_db.html) nearly every poll shows the party declining steadily from a peak in early-mid 2009.
  • Second, the decline of SDKU did not (yet) accelerate after Smer attacks. We only have two polls for the post attack period–Polis focus sdku 2010and Focus–and both show SDKU within 0.2 percentage points of its December levels.  The appearance of a steep drop was created not by unusually low results for SDKU in the February FOCUS poll but rather by unusually high results for the party in the January poll.  FOCUS can’t really use this as an explanation lest they undercut their own polling methodology (though some noise is simply part of the business), but as the red arrow in the graph below shows, January stands /way/ out.  As the blue arrow shows, FOCUS’s December and February results (and November as well) stand in an extremely relatively narrow band.  Of course the scandal may still hit home, but there is very little in the available data to suggest that it had any effect.

The story is right in one way, but even that is misleading.

  • There something of a reciprocal relationship between SaS and SDKU support
    SDKU’s decline is certainly related to the rise of SaS.  Except for that one month, Focus has shown a steady decline for SDKU from around 16 to around 12.  Polis has shown a decline from around 18 to around 14 (but interestingly did not show a decline for February when the scandals hit).  MVK has shown a decline from around 15 to around 9 (from a poll that emerged /before/ the Dzurinda scandal).  This is almost perfectly parallel with the rise of SaS.  The scandal may contribute to an SDKU decline in the long run but it is one that was already occurring because of the emergence of a relatively plausible non-Dzurinda pro-market party.  And of course the scandal may also indirectly contribute to an SDKU revival if it shifts the face of the party to somebody who is not connected to Dzurinda.
  • …But the tradeoff is not zero-sum.  SaS is also finding other supporters. sk bloc vote roughThe most interesting thing about the SDKU-SaS relationship (along with KDH) is that support for these three “right” parties has actually seen a significant collective rise over recent months, as the highlighted portion of the graph shows.  It would appear that SaS has helped to bring new voters into the mix and re-energize some disillusioned SDKU voters (and Figel’s new energy in KDH has helped a bit as well.  So as long as all three parties remain above the threshold, this is a welcome step for Slovakia’s opposition parties.  It is interesting that Slovakia’s right has only been able to attract above 25% when there has been a third right party other than KDH and SDKU (specifically ANO and later SF) (The same dynamic incidentally applies in the Czech Republic with the Christian Democrats, ODS and a non-ODS right wing party–ODA, then US, then SZ then TOP09).

Finally, the graphs that demonstrate the positive contribution of SaS to the Slovak “right” also demonstrates another story that has gone largely unreported in the Slovak press because it’s development has been more gradual:

  • The most significant shift has been the decline of ethnic Slovak national parties. sk bloc vote smoothThe same graph here, smoothed using the LOESS technique (thanks to Charles Franklin of http://www.pollster.com for the advice and Jon Peltier of http://peltiertech.com/WordPress/ for the Excel add-in) shows this in high relief.  Perhaps the smoothing is a bit too great for comfort here but the patterns are not different from those of the month-by month graph: until mid 2008 Slovakia experienced a fairly stable pattern of increase by the “left” and slight declines by the “right,” and the Slovak and Hungarian national blocs; in mid-2008 this began to change, first with sharper declines by the Slovak national parties followed by recovery by the Slovak right (likely thanks to Radicova in the spring and SaS in the fall) and recovery by the Hungarians (thanks to the emergence of Most-Hid, though if it fails to get into parliament or pushes SMK out it will prove to be a highly mixed blessing) and most recently by a reversal of the left as the party dropped from its early 2009 peak.  I suspect that these trends are leveling out more than the graph would suspect but the smoothing does help to take out some of the monthly noise (see above) and help us figure out what’s going on.  More on that in the coming ppp posts.


News for those obsessed with public opinion in Slovakia

may cause drowsinessThose of you who are not deeply interested in how Slovaks vote (i.e. nearly everybody) can tune out.  Those of you who are interested, I understand your pain, and you can now find all of this blog’s monthly public opinion graphs available in one place by clicking the “Dashboard” link on the top of every page.  If it doesn’t work for you, leave a comment that lets me know what browser you are using (I.E. versions seem to have particular problems) and I’ll be glad to send you an updated PDF.  I’ll still be inserting graphs in posts, but this is one way to get the data up quickly without spending time on analysis, and maybe that will prevent me from being so late in posting the data.

News and New Resources on Public Opinion in Slovakia

Update:
Because of formatting problems with certain versions of Internet Explorer , this page is now available as a .pdf file: 2009_12_30 Pozorblog Public Opinion.

I should begin with apologies for such a long hiatus and also with hearty congratuations to Monika Tódová of SME for writing one of the best articles on the process of public opinion polling in Slovakia: Prieskumy môžu politikov miast. It’s not very long but it finally addresses the problem of dueling headlines–“SaS/Most-Hid poised for success” v. “SaS/Most-Hid has no chance” (often in the same newspaper in the same week) and asks “How is it possible?” The answer lies in the ways that various pollsters survey the public, and it turns out (perhaps I should have known this) that FOCUS and MVK (and previously UVVM) offer a list of parties to choose from whereas Median gives no list. The latter method, of course, will tend to benefit those parties that are best known, while the former can give a boost to parties that are little known (and the process by which firms choose to add parties to their formal lists is fraught with difficulty.

The question now, is whether Todova’s article means a change in approach. Her article is the first instance I can remember outside of election campaigns when an article juxtaposes results from multiple pollsters. I can only hope that this will be the beginning of a trend even if (especially because) it might put this blog out of business. But I’m fairly secure that the time and space constraints of Slovakia’s papers will not let that happen and so there will be room for a blog obsessed with the minutiae of public opinion in Slovakia.

But just so that this blog does not immediately become obsolete, I want to share a new method I’m working on for displaying public opinion results. This is not quite ready for prime time, but using the Timeplot application developed as part of the astounding SIMILE project at MIT, it is possible to create dynamic charts that are fully modifiable and easily updated on the basis of simple text files. Of course that meant that I had to clean up my database, but now that that’s done, I should be able to present updated public opinion results with a minimum of effort (that’s the theory) and can even, theoretically, create a dashboard page on the blog itself for those who want to look at the numbers rather than read my analysis.

Below are examples of what is possible. I’m preparing a year end summary, so you’ll see these graphs again soon with some analysis attached.

September 2009 Poll Results: Whither Smer?

This post comes a bit late because of changes to the pozorblog site but the month’s news is important enough to warrant an interim post.

Things only changed a little this month. But small changes from one month to the next add up. And this month not all the changes are small. A few areas to watch.

Smer

September 2009 Graphs_Page_01

As the image shows Smer remains far above its nearest competitors–still well over double the preferences of SDKU. But the last four months have seen a drop in Smer preferences from the mid-40s to the high-30s. This shift is primarily in FOCUS polls, however, and it is difficult to say whether the result is “real” or some sort of blip. Median, the only monthly alternative, shows no similar drop. I am really missing UVVM this month as it was always helpful to see what a second pollster said before making a judgment, and MVK polls are as unpredictable–in their appearance, not their results–as weather.

September 2009 Graphs_Page_05Closer look at Smer polls over time show a gradual increase over the last two years peaking in a cluster in late 2008 and then reverting back to the previous plateau and now, again to a lower level, though whether that lower level is part of a plateau or a slope is something we will have to see about. I suspect next month will show Smer higher in Focus polls but lower than its average level for the last 5 months. I suspect this month’s drop is a bit of an outlier, just as its previous peaks did not always sustain themselves and appear to be noise rather than signal.Smer doesn’t have too much to fear–it’s still hard to calculate a way that it won’t be in the next government, but it wouldn’t surprise me if some mid-level Smer types were starting to work on their political insurance policies.

SDKU and KDH:

September 2009 Graphs_Page_02Take Smer out of the graph and it looks more like a competitive party system. And this fall for the first time in a long time, the two top competitors to Smer are both from the opposition: SDKU and KDH. SDKU dropped slightly this month in FOCUS polls but it’s still near a historic high (in the past it would do this well in elections but not in polls). Some of its slight decline may relate to the rapid resurgence of KDH, a party that has taken a sudden upward jump due, I must think, to the energizing presence of Jan Figel, former European Commissioner. I am interested to see whether Figel’s more proactive approach will keep the party preferences high. In some sense, this does not help the opposition much, since those attracted to Figel are probably those who would otherwise hold their noses and vote for SDKU, but since they might also vote for SaS, it keeps votes among the larger opposition parties. Thumbnails for SDKU and KDH are here:

SDKU——————————————————– KDH

September 2009 Graphs_Page_06September 2009 Graphs_Page_10


HZDS and SNS:

Slovakia’s two minor governmental parties continue their respective slow slides, partly the result of Smer’s remarkable skill at picking off their voters and partly the result of their own internal struggles and disadvantages. HZDS has stopped falling for the moment but given the party’s steady 10 year slide and absence of anything new that might recommend it, it is hard to imagine anything but continued decline (with the key question: 5% or not 5% next June). SNS’s decline has been disquised at times by the party’s erratic support shifts but it is notable that all of the trendlines (24-month, 12-month, 6-month and 3-month point down at almost the exact same angle). The party has more leeway for falling than HZDS but it is not immune, and at some point SNS mid-level leaders are going to need to decide what to do if they feel that Jan Slota is pulling them down. The party’s structures are so focused around the party chair that the only way to force change will be to leave, but the last time they did that the parties split the electorate 50/50 and neither got into parliament.

SNS——————————————————– HZDS

September 2009 Graphs_Page_07

September 2009 Graphs_Page_09


SMK
and Most-Hid

Not much to say here, yet. For two polls in a row both parties are poised to make it into parliament. If this can continue then Bela Bugar has done a big favor to the Hungarian electorate, bringing back those disenfranchised from SMK. If both don’t stay above 5 and neither drops to near-zero, then the Hungarians will see their poorest electoral showing since the early days of Slovakia’s democracy. I’d be keen to hear any thoughts from Magyarophones about what to expect here as this is a subset of the population from which I hear little direct news.

SMK (regular graphs for Most-Hid coming soon)

September 2009 Graphs_Page_08

Smaller Parties:

Not much news here this month. SaS shows staying power at around 3%, and KSS recovered this month to its traditional 3% levels as well (though it has not been there for awhile). Below, around 2% stands SF (recovering slightly from a major drop the previous month) and at at the flatline level are OKS, KDS, ANO and Liga (which didn’t get a single person to mention it’s name this month even though it’s on the list). Between them are two more: HZD (slightly higher than expected–it’s been flatlining) and the Greens (somewhat lower than expected–last month it even beat KSS).

What it all means? The Coalition Partner Game

It’s still Smer’s ballgame, but coalition politics could become extremely interesting if Smer does end up at around 35% and HZDS or SNS fall below 5%. It is dangerous to trust what parties say about potential coalition partners, but as of now, SDKU and KDH appear to have ruled out coalition with Smer (Dzurinda is right, I think, to note that such a coalition would severely hurt his party, and he doesn’t have the organization or track record to ride it out the way ODS and CSSD did with their opposition agreement in the Czech Republic). But if this option truly is gone, then there are few other combinations that can make 50%. If the existing coalition can’t muster 50% because one party drops off, then Fico would need to find alternatives, but (even though I generally do not rule things out) there will be no coalition containing both SNS and either SMK or Most-Hid, and SaS, the only other party that looks now to have a chance, has promised up one side and down the other that it will not join forces with Smer. So Smer’s only real chance is probably SNS+HZDS or so many votes for parties that fall below the threshold that it can with SNS or HZDS form a bare majority government.

At the same time, there’s not much hope for a government of the current opposition parties. Even with SDKU and KDH and SMK and Most-Hid and SaS, there’s nothing like a majority. It might be possible to create one by adding HZDS to this but even that’s unlikely and HZDS is the party in greatest danger of falling short. In 10 short years, HZDS has gone from a huge and polarizing force in Slovakia’s politics to a tiny but necessary coalition partners. The more things stay the same, the more they change.

Wanted: Effective journalism in Slovakia

Median logoI know Slovakia’s journalists are overtaxed with all that is required of them, but there are things they could do to make things better without too much extra work.  Case in point: today all major Slovak news sources today report, almost word for word, a press release from the firm Median reporting poll results from July:

The reports differ a bit, of course: SME and TA3 have a graph, Pravda has a table with past results from Median, HN relates the results (with no actual evidence) to the effect of recent scandals.

What none of them does is to answer the important question about Most-Hid.  Median, for reasons that are not clear, does not report on parties that do not cross the 5% threshold, and all the papers report that fact.  What they do not do is to say just how well Most-Hid actually did.  Here’s where journalism comes into play.  If the role of journalist goes beyond simply typing (or in this case probably pasting what others send to you) then it may be to try to find answers to important questions.

So here’s my suggestion: call Median and ask them 

If Median won’t answer, ask them why.  Focus reports its polling results with an extremely detailed and effective one-page report.  UVVM used to do the same.  There is no reason the papers should print Median’s results unless they are willing to rise to the same (bare minimum) standards. If Median won’t play that way, write a story about the fact that Median won’t provide necessary information):

If Median won’t answer and you still want to figure out something about Most-Hid’s initial support (a quite important detail), here’s my second suggestion: do some math.

If you add up the total support for the parties listed by Median in past polls, you get a consistent result of about 97% for May and June.  That means other parties are getting about 3% (specifically 3.1% in May and 3.3% in June).  If you add up the total support for July you get 92.3%.  That means other parties got 7.7%.  Of course this doesn’t tell you how well particular parties did, but it’s worth reporting that the “Other” number rose by 4.4% and citing the FOCUS numbers which show that support for below-threshold parties actually did not change systematically during the same period (9.0% in May, 12.5% in June, 10.2% in August), meaning that a large share, of not all of the 4.4% probably went to Most-Hid.

Total cost of these important details: one phone call and/or 2 minute 3o seconds of addition and subtraction.

If this lack of effort applies in this specific area, it’s probably also true in areas where I do not read.  It’s time for Slovaks to demand better journalism.

August 2009 Poll Results: Bending The Mold

Poll results, last 12 monthsThe pattern looks familiar and the lines haven’t changed much, but there are a few ways that this month’s results by FOCUS change our understanding of the current political competition.

I have actually been fearing this change for a long time–not because of the actual politics involved but because of the emergence of a new party.  The graphs in this blog are the product of a long and complex process of fighting with Excel to produce results that can be read by Google’s chart API (about which I understand little, but which is quite remarkable).  That process has produced an elaborate set of calculations which are, unfortunately, based on the presumption of a certain set of parties (and only those parties) gaining election to parliament.  This month holds quite a few big changes in public opinion and one of those–the emergence of Most-Hid with just over 5% of the vote–means that my old systems won’t work anymore.  This is good news, in a sense, because it gives me the impetus to find a solution that will not require as much work (calculating in Excel, creating the google charts, posting separately to Google Docs), but for the moment it makes things more difficult.  I will therefore resort to Excel charts for awhile.  And now, after that pointlessly detailed introduction (I buried the lead again), the graphs and then some thoughts on anybody should care:

Poll results, last 12 months

And the same graph without the distorting scale effects of Smer:

Poll results, last 12 months minus Smer

1. Most-Hid might make it into parliament
This may not be a surprise (Bugar is quite popular among Hungarians) but it is important, and the way the numbers fell is important in several ways:

  • Most-Hid v. SMK is not exactly a zero-sum game.  This month’s 5.3 score for Most-Hid came at relatively little cost to SMK which has dropped only about 1 percentage point in the last 4 months.  Of course SMK has dropped quite a few percentage points since Csaky became party chairman (and even before while Bugar was still chair) but it would appear that the party has brought disaffected Hungarians back into the political system rather than stealing directly from SMK.  As a result, Hungarian parties combined scored the best public opinion result that Hungarian parties have received in almost 5 years (since January 2005).  All of the opposition’s gains this month can be traced to that single re-mobilization.
  • Both can get into parliament.  There has been some discussion about whether the two parties might split the vote down the middle (as SNS and PSNS did in 2002) and lose representation altogether.  The results from today suggest that a 50-50 split is actually an ideal result for the Hungarian population in Slovakia.  More worrisome would be a 60-40 split, cutting the Hungarian representation nearly in half.  Of course there are some who suggest that infighting among Hungarian parties could disaffect enough to push Hungarian turnout so low that a 50-50 split would deny representation to both, but this month’s good results come after bitter conflict, so it is hard to imagine how bitter the conflict would need to become to provoke the worst case scenerio.
  • Things are far from over.  It may be that these two parties split the Hungarian vote.  It is more likely that one will tend to prevail over the other, either Most-Hid because of more dynamic leadership or SMK because of stronger organization and tradition.  This is one of the keys to the outcome of the next election so it bears considerable watching.

2. SaS has a (small) chance
This is something of a stretch because the party is only at 3.4%, but unlike the other small parties on the “right” it shows a positive trajectory.  KDS has stalled below 0.5%, and Liga appears stillborn (in eight months of polls the party has racked up a total–not average, total–of 1.4%).  OKS and ANO are effectively dead and DS and Misia21 exist only on paper (and barely there).  The big loser in this is probably Slobodne Forum which looked to be doing well in late spring, but SaS’s much better performance in the Europarlament elections appears to have given it the edge.  We have too little data to tell if it is a meaningful pattern, but SaS’s growth so far has been almost perfectly proportional to SF’s decline.

3. Smer’s recent decline continues
There is no real cause for gloom in the party (it is still almost three times the size of the next largest alternative) but it has dropped by nearly 10 percentage points from its (admittedly unrealistic) peak of early this year (when it was four times the size of the next largest alternative).  Since the 2006 election the party has peaked and waned five times, so the variability is nothing new, but this is the first time that the party has dropped sharply from a plateau rather than from a peak.  Of course it is safe never to rule out the possibility of recovery to new heights, but it is more likely that the weight of a poor economy and a large number of corruption scandals, some perhaps not so minor, have begun to take away some of the luster.  This may not be a huge loss for the party as many of those shifting away are likely the supporters who wouldn’t bother to turn out to vote for it (as they didn’t in the Europarliament elections).

How it adds up (Smer’s threshold for success)
The big question is the intersection of the points above:  the emergence of Most-Hid creates two parties that may or may not pass the 5% threshold.  SaS adds a third.  HZDS is the fourth (the party got a slight reprieve this month but even with that the 6-month, 12-month and 48 month trendlines show it dropping below the 5% threshold by spring and only the 24 month trendline puts above by about 0.5 percentage points, though the party’s loyal base also makes it necessary to adjust the numbers upward a bit in its favor).  Since each of these parties could dispose of between 3% and 6% of the overall vote and since the magical 5% makes or breaks the party’s parliamentary representation, a lot will be riding on the results.  My preliminary calculations suggest that in a worst case scenario for Fico–if SaS, Most-Hid, SMK and HZDS all made it into parliament–Smer would need 41% to be able to form  a two-party government with SNS (assuming that SNS’s preferences do not also continue to decline), though it could also settle for a three-party coalition identical to the current one (and it could sustain that coalition even if its own preferences dropped as low as 31%).  If HZDS failed to pass the threshold, Smer would gain some seats from the redistribution but not enough to overcome the loss of a potential coalition partner:  if HZDS falls and both Hungarian parties and SaS survive, Smer would need all of its current 38% to form a two party coalition with SNS.  Of course it is unlikely that all three of the smaller opposition parties would succeed.  If one of them fails, Smer could get by with 33% and if two of them fail, the Smer could form a majority two-party coalition even if it got only 28%.

This all deserves more thought and calcluation.  With any luck I will have opportunity to do just that.

April 2009 Final Poll Comparisons

There is an old Communist-era joke in which one character asks the other, “Why weren’t you at the last party meeting?” and the other responds “If I had known it was the last party meeting, not only would I have shown up but I would have brought a bottle of champagne.”  In a similar–if more unfortunate vein–when I talk about the last UVVM survey of public opinion in Slovakia, I mean the last one.  The Statistical Office of the Slovak Republic has stopped the monthly public opinion polling on parties that gave Slovakia one of the most robust public-opinion tracking data of any country in postcommunist Europe.  The office has been discussing this for over a year (the director of the office, Ludmilla Benkovicova, discussed this with me in an interview in June 2008 and it was in the air well before then) but it is awkward for all concerned that the polling ceased precisely at a point when, according to a report by Pravda (http://spravy.pravda.sk/hzds-a-sns-nepadli-popularitu-straca-len-smer-faz-/sk_domace.asp?c=A090425_120119_sk_domace_p23) the ruling party, Smer, allegedly received its lowest support in over a year-and-a-half, and the ruling coalition allegedly received its lowest support since the June 2006 election.  I write “allegedly” because in addition to ending the party preference polls, the Statistical Office also embargoed the results of April poll that included those numbers and we have them in the public realm only because Pravda claims to have obtained a copy (which it also claims that Benkovicova did not deny).

It is hard to know what to make of Benkovicova’s decision since she cites an EU directive with which I am not familiar and since it is possible to make a good argument against government sponsored polls as the centerpiece of a country’s polling infrastructure.  At the same time, UVVM has done excellent work and has seemingly remained immune from political pressure.  Furthermore, while the circumstances and motives of the current decision might be entirely different, it is also worth noting that the last time UVVM stopped public release of polling information on political parties, it was during the government of Vladimir Meciar.  The polls came back after Meciar left.  We shall see if they do so again after Fico’s departure.

Because of the informal nature of the release of the UVVM April data, we only have a partial range of figures (none of the smaller parties or the share of non-voters) but fortunately we also have numbers from FOCUS for the most recent three months.  There are also numbers from the firm Median but I am hesitant to put these into the broader model as they lack the track record of the others.  I will try to do some more analysis of Median numbers and see over the next few month whether these are worthy of inclusion.

So what do we find. The graph averaging the last 24 months of polling results from multiple sources shows a drop for Smer back to the plateau it reached during the final months of 2008, the first time since the 2006 election that Smer has seen three consecutive months of drop.

2:||||||||||||||||||||||||Multiple-poll+average+ for +all+parties+ for the most recent +4+months+ in Slovakia

The drop comes off a record high, however, and so the news is not terrible, especially since while UVVM numbers showed a big drop (to 40%), FOCUS numbers showed the party increasing slightly.

Multiple-poll+average+ for +Smer+ for the most recent +4+months+ in Slovakia

This graph averaging the last 4 months of polling results from multiple sources shows this in more detail and suggests a minor shift in the overall dynamics of party competition.  Whereas originally there had been 4 groups of parties (Smer on its own above 40, SDKU and SNS between 10 and 15, HZDS, KDH and SMK between 5 and 10 and then a group of parties under 3, there are now 4 different groups (Smer alone, still above 40, SDKU in clear second above 15, SNS, KDH and SMK between 5 and 10 and parties under 3.

UVVM+poll+data+ for +all+parties+except+Smer+ for the most recent +4+months+ in Slovakia

This graph of recent polling results for SDKU shows a strong recovery–some of the highest poll numbers SDKU has ever had–perhaps because of the relatively strong performance by its presidential candidate, Iveta Radicova–but this bump may not long survive Radicova’s return to relative obscurity.

Multiple-poll+average+ for +SDKU+ for the most recent +4+months+ in Slovakia

This graph of recent results for SNS shows a consistent, slow drop even before the most recent ministerial scandals.  I am curious whether the apparently high levels of clientelism within the party can dislodge even its most passionately anti-Hungarian voters.

Multiple-poll+average+ for +SNS+ for the most recent +4+months+ in Slovakia

The wildcard here is HZDS.  In a February blog entry, I wrote that

“there is a strong chance that the party will post at least one or two results below the 5% threshold in the months just before elections, a symbolic result that could further hurt the party’s chances.”

That moment came sooner than I expected, at least in FOCUS surveys and so significant was the drop that I had to change the scale of the HZDS graph.

Multiple-poll+average+ for +HZDS+ for the most recent +4+months+ in Slovakia

HZDS has a strong cadre of loyal voters–stronger than most other parties of similar or even larger size, but at present the party’s slide is accelerating rather than slowing.  The current numbers put HZDS soon in the under 3% group.  The best case scenario for the party is somehow to hang on near the bottom of the 5%-10% group.
In broader terms these changes suggest a small closure of the gap between opposition and coalition parties, but the gap is still almost as large as the percentage of the opposition parties themselves.  It would take a lot to close the gap completely though of course “a lot” is what the current world economic crisis threatens to deliver.

Multiple-poll+average+ for +coalition+support for the most recent +24+months+ in Slovakia

The long-term graph of poll results for (loosely defined) party “blocs” parties shows parallel declines in the “left” and “Slovak national” blocs of parties and some aims for the opposition “right” bloc, but this again is not nearly enough for a change of government.

Multiple-poll+average+ for +party+blocs+ for the most recent +24+months+ in Slovakia

This month’s distribution of parliamentary seats shows Smer still in a position to form a one-party government with any partner, though its most likely partner, the Slovak National Party, is the one which has seen the dismissal of two ministers and a variety of other criticisms in a short period (though a variety of Slovak analysists suggest that the party needs its government posts (and the wealth to which they give access) too much to complain (http://spravy.pravda.sk/koalicia-vydrzi-sns-potrebuje-zostat-vo-vlade-zhoduju-sa-analytici-1pv-/sk_domace.asp?c=A090505_170429_sk_domace_p23)

Multiple-poll+average+ for +estimated+party+seat+distribution for the most recent +1+month+ in Slovakia

Multiple-poll+average+ for +estimated+party+seat+distribution for the most recent +24+months+ in Slovakia

And finally, because they did not fit into the narrative above (if such a disjointed string can be described as a narrative), a few other specific poll numbers.

The graph of recent results for MK shows stability and a degree of convergence among polls at around 8.5%.  The surveys were taken before Bela Bugar left the party’s parliamentary delegation, however, so we shall see over the next two months whether that has any effect.  We shall see over the next year whether we have a full split on our hands here.  If so, the normally solid representation of Hungarian parties in parliament may come under threat.

Multiple-poll+average+ for +MK+ for the most recent +4+months+ in Slovakia

This graph of recent results for KDH shows convergence as well with little change in average over time.  This is the one party to which nothing has happened over the last several months so the stasis is not unexpected.Multiple-poll+average+ for +KDH+ for the most recent +4+months+ in Slovakia

The graph of recent results for KSS shows a drop, particularly noteworthy since FOCUS numbers which usually put the party around 2% put it here under 1% for the first time in about a year.

Multiple-poll+average+ for +KSS+ for the most recent +4+months+ in Slovakia

Finally the graph of recent results for SF shows a steady rise.  Whether this party is a contender for 2010 (I predict that some pro-market social liberal rival to SDKU will flirt with the threshold in the months before the next parliamentary election but I don’t know that it will be SF, though that party has a better chance than some.  It has something of an organization and some name recognition, while neither Liga nor SaS appears to have yet found legs, but there may be another contender out there somewhere as well.

Multiple-poll+average+ for +SF+ for the most recent +4+months+ in Slovakia

FOCUS numbers show a stable 1.1% or so for the Green party (ZS) in the last two month, and really low numbers (between 0.1% and 0.5% for Liga and KDS.  OKS actually appeared above 0.0% for the first time in years (perhaps because FOCUS is asking about it now), and its emergence significantly undercut KDS (if anything can be called significant under 1% or understood as anything other than random noise.)

As always, the actual polling numbers are available online at Google Docs:
http://spreadsheets.google.com/pub?key=pdhlCClsiyAMi39bLFpY_Zg

And the most recent three months are below in tabular format (using “iframe” which may not work on all browsers).

<br />

January 2009: FOCUS echos UVVM

January 2009 poll comparisions and averages

I should have known to wait for the FOCUS numbers to come in before writing yesterday’s post.  FOCUS is coming in much more quickly these days.  This month, however, one or the other would have been enough as the results are strikingly similar.  The two polls show the same trends for every major party.
For Smer the two moved in the same direction, almost perfectly.  Gone may be the day when FOCUS was much lower than UVVM on numbers for Smer.  Whether this is the result of a shift in network, methodology or the end of a long string of chance differences, I cannot say.  (Anyone know the answer?).  This month showed a decline from a peak in both.

Multiple-poll+average+ for +Smer+ for the most recent +4+months+ in Slovakia

For SDKU the resultsof the two polls have been shockingly close for three months now.  SDKU has stabilized, perhaps helped a bit by Radicova’s presidential campaign (perhaps not).

Multiple-poll+average+ for +SDKU+ for the most recent +4+months+ in Slovakia

This graph of recent results for SNS shows a fairly wide divergence but similar trending–very slowly downward since December.

Multiple-poll+average+ for +SNS+ for the most recent +4+months+ in Slovakia

This graph of recent results for MK shows a slight rise in both polls, though the 2% gap is wide for such a small party.

Multiple-poll+average+ for +MK+ for the most recent +4+months+ in Slovakia

The two polls’ numbers for HZDS are (as they have been) incredibly similar.  HZDS has reached its lowest recorded numbers in both polls (though with FOCUS this represents a tie with its numbers from August 2008).

Multiple-poll+average+ for +HZDS+ for the most recent +4+months+ in Slovakia

This results for KDH show greater similarity between polls than during much of last year.  Both polls have shown essentially identical results for January and February and this time it is good news for KDH which has risen in both, even after its vice-chair Daniel Lipsic raised a storm by talking about his party’s participation in the “buying” of deputies during the previous parliamentary term.

Multiple-poll+average+ for +KDH+ for the most recent +4+months+ in Slovakia

This graph of recent results for KSS shows little change from last month with the two polls placing the party in its traditional zone between 2 and 3%.

Multiple-poll+average+ for +KSS+ for the most recent +4+months+ in Slovakia

This graph of recent results for SF shows a small gain in both surveys moving it toward 3%, up notably from its nadir a year ago at less than 1%.  The party’s gains have been steady, so it is difficult to attribute this solely to the increased visibility due to party chair Martinakova’s presidential bid, but this may help.

Multiple-poll+average+ for +SF+ for the most recent +4+months+ in Slovakia

The two other oft-polled parties, remain insignificant.  ANO broke 1% for the first time in 5 months in the FOCUS poll but was nearer to zero in the UVVM poll; after some respectable (for it) showings around 2% in the past months, HZD is back at around 1% in both polls.

Finally, FOCUS has decided to continue with its addition of small parties–KDS, ZS and LIGA.  Each of these parties did better than in the previous month of polling by FOCUS: ZS rose from 0.4% to 1.0%, almost identical to its 1.1% result in UVVM polls.  KDS rose from 0.3% to 0.6% (at the same time that KDH rose several points) in the FOCUS poll.  LIGA rose from 0.3% to 0.4%.  So far SaS is present on the polling list only of MVK and we do not have MVK numbers for January or February.

Since the two polls showed such similar results, averaged all together it is almost indistinguishable from yesterday’s report on UVVM.  Smer leads, SDKU stays stable, SNS and HZDS drop slightly, KDH and SMK rise.

2:||||||||||||||||||||||||

UVVM+poll+data+ for +all+parties+except+Smer+ for the most recent +4+months+ in Slovakia

This means that the coalition stops its climb and the opposition stops its fall and so we are back almost exactly to mid-2008, though with HZDS a bit weaker and Smer a bit stronger.

Multiple-poll+average+ for +coalition+support for the most recent +24+months+ in Slovakia

The only really noteworthy result of analysis by bloc is that the “Slovak National” bloc falls to its lowest recorded levels (around 18%).  I doubt that these voters have lost their national sentiment, but they may have shifted to KSS or Smer (or even KDS?) which are not exclusively nationally oriented.

Multiple-poll+average+ for +party+blocs+ for the most recent +24+months+ in Slovakia

This month’s distribution of parliamentary seats shows that this all makes little difference so far in the big picture.  As always, Smer can form a government with only one partner (and since the numbers putting Smer with a simple majority last month were unlikely to be reached in an actual election, this is the way it has been essentially since the 2006 election.)Multiple-poll+average+ for +estimated+party+seat+distribution for the most recent +1+month+ in Slovakia

Multiple-poll+average+ for +estimated+party+seat+distribution for the most recent +24+months+ in Slovakia

As always, the actual polling numbers are available online at Google Docs:
http://spreadsheets.google.com/pub?key=pdhlCClsiyAMi39bLFpY_Zg

And the most recent three months are below in tabular format (using “iframe” which may not work on all browsers).

<br />