Polls, Parties and Politics, Part 8: Coalition Math, now with Thresholds!

Having just spent quite a bit of time thinking about Czech politics (and expecting to do so again once we get Saturday’s election results) I am struck by how different much of it is from Slovakia–and how much is quite (perhaps increasingly) similar.  Unlike Slovakia’s politics, Czech politics still revolves around a left-right axis on economic issues, but the two parties that anchor that axis have weakened and the emergence of new parties clearly suggests the underlying role of at least one or two additional dimensions (corruption is the most obvious).  The flux of party death and party birth also seems likely to be similar this year, if not greater on the Czech side.  And as in the Czech Republic, the composition of government looks to depend on the ability of parties to cross the 5% threshold of electibilty (see yesterday’s post).  But this points back to another difference, extremely narrow but highly consequential for thinking about elections and government formation: in the Czech Republic there is only one party that is hovering around the 5% threshold.  In Slovakia, there are four.  This is a big deal because those parties are on opposite sides of the spectrum, and every one of the 16 (4^2) permutations has a significant potential impact on who will govern Slovakia.

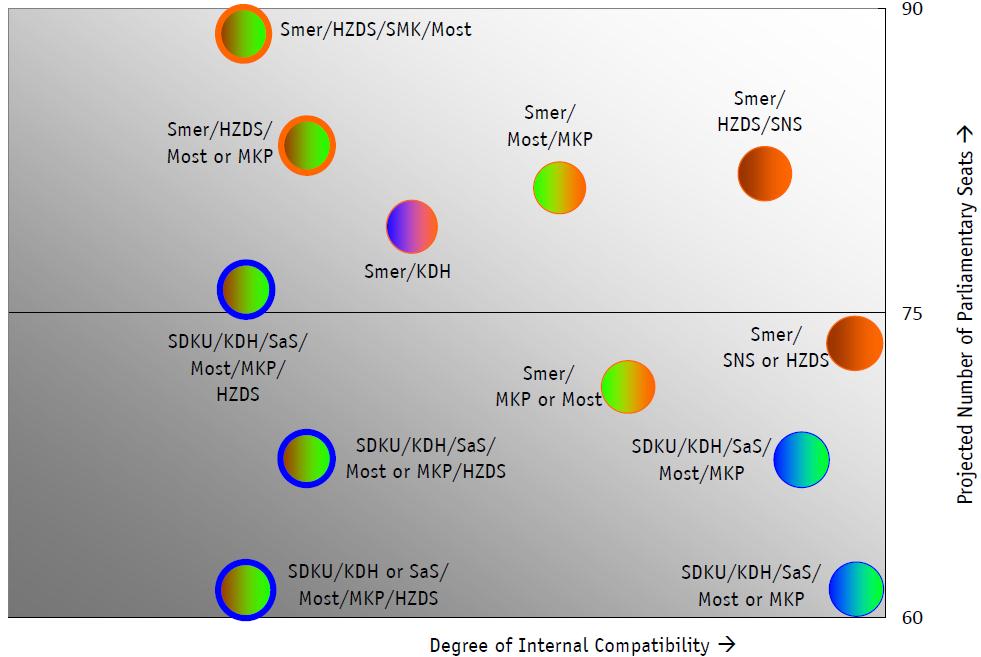
Before we can look intelligently at the effects of the thresholds, however, we need to look at the broader issue of viable coalitions.  As I’ve discussed before, coalitions are a combination of math (are there enough seats) and “chemistry” (can they get along).  In a post in mid-February, I made certain guesses about both math and chemistry that I summarized in this image:

Since then several things have changed.  First, we have much more recent polling data (showing a trend away from the current coalition) and second we have both new statements by parties about potential coalition partners (a delicious.com feed of relevant articles is here), and new data from FOCUS/IVO about what party supporters think of other parties (the original report is here).  From this data I can create a new version of the graph on a slightly sounder but still quite imperfect basis.

The first imperfection is that I will foolishly make utterly unwarranted guesses about what I think the data now suggests about the final election results, based on the one prediction tool that seemed to work in 2006: pre-existing trendlines.  This is, of course, mindbogglingly stupid, when in 2006 I made predictions based on one prediction tool they were in many cases far off.  But without a prediction, I can’t go any further.  So here I … jump:

Party Terribly fraught guess
about election outcome
(trendline projection adjusted
by common sense)
Number
of seats
based on
fraught guesses
Smer 35.0% 57
HZDS 5.0% (see below for nuance) 8
SNS 6.0% 10
MKP-SMK 5.8% 9
Most-Hid 5.2% (see below for nuance) 9
SaS 9.0% 15
KDH 11.0% 18
SDKU 15.0% 24

For the moment, we do not need to worry about the threshold (and in any case the recent averages show all eight parties above the threshold, though in some cases just barely).  This will come later.  From the percentages above, I calculate a raw number of seats for each party (that can later be nuanced based on threshold questions.)

The second imperfection relates to some way to quantify the “chemistry” (or usually the lack thereof) in a coalition.  To do this I have simply taken IVO’s measurement for the overall level of antipathy that supporters of each party has toward each of the other parties.  This is imperfect at best but it actually worked quite well as an indicator of most likely coalitions in both 2002 and 2006 (where I ignored it to my peril).  That doesn’t mean it will work this time, but it is also fairly consistent with the kinds of statements that parties make about one another, so it is adequate as an initial proxy.

Putting the number of seats on the vertical axes and the level of chemistry (inverse of antipathy) on the horizontal axis yields this lovely graph showing the position of each coalition.

But since neither of these indicators is perfect, it is less misleading about the specificity of the data (and more interesting and attractive) to recast the graph like this:

Here the orange dots represent Smer-based coalitions while orange and dark green/brown represent the Slovak national members of the current coalition.  Blues represent parties of the Slovak “Right” while light green and gold represent Hungarian national parties.  The quick conclusions:

  • No combination achieves the grail of significant size and positive internal chemistry.
  • The closest aspirants are the current coalition and the current opposition, which by this estimation each have exactly the same number of seats–a deadlocked 75.  In a parliament in which all eight parties enter, a comfortable margin above 75 seats requires broadening the coalition to include somebody from the “other side” either Smer including a Hungarian party or two, or the current opposition including HZDS.  More coherent coalitions, by contrast, have almost no chance for electoral success (and, given Slovakia’s complicated 2+ dimensional political landscape, almost never have).

BUT…  This assumes that all parties will make it over the threshold.  By my estimation, this is actually fairly unlikely

Party Terribly fraught
guess about chance
of passing
5% threshold
Smer 100%
HZDS 50%
SNS 75%
MKP-SMK 90%
Most-Hid 55%
Both Hungarians* 60%
SaS 99%
KDH 99.9%
SDKU 99.9%
* More than the product of the two Hungarian parties individually because if one falls short of the threshold, it is probably because the other has gained some of its votes

As the asterisk above, suggests, however, it is not enough simply to run an analysis of these parties individually above and below the threshold because there are reciprocal relationships among parties that affect shifts in voters. Although this is certainly true for SDKU, KDH, and SaS, shifts among those three do not have much effect on overall outcomes since they are all above the threshold. The same is not true for the pairing of SNS and HZDS, and especially of Most-Hid and MKP-SMK, whose reciprocity is almost perfect to the extent that it is difficult for MKP-SMK to gain except at the expense of Most-Hid, and (almost) vice-versa. If MKP-SMK falls below the threshold, Most-Hid will almost certainly rise above by about the same margin. The same is true to a lesser extent for SNS and HZDS. As a result, I have built these parings into the overall equation (realizing, but for the moment not caring, that some lost HZDS or SNS vote may go instead to Smer).

The result of these various calculations is the chart below which identifies eight possible arrays of parties in parliament along the top and eleven possible governing coalitions down the side, identifying the probability of the arrays based on the electoral guesses above, the likelihood that all potential coalition members pass the 5% threshold, and the approximate number of seats gained by each coalition given the parliamentary arrays. Red boxes indicate that a coalition should fall well short of a majority; green boxes indicate a safe likelihood of a majority; yellow boxes indicate something in-between.  (The task at hand has so many data points attached to it [and my attempt to squeeze it onto a single page is so obsessive] that it is difficult to compress into something that will fit into this blog column, so it is probably necessary to click on the image to see the full graph.)

So here is all the data in one place, but what does it mean.  We can cut the data in two ways: by coalition type and by parliament type.

Category Party Competition Likelihood of parties crossing threshold Possibilities and Constraints
Left + Slovak National (current coalition) Smer +
SNS + HZDS
38% If all parties in this coalition make it into parliament, it will likely have a majority. But there is a less than even chance (by my estimation) that both HZDS and SNS will make it.
Left Smer 100% Smer will make it into parliament but there is no scenario according to current preferences that would allow it to govern alone (except as a minority government)
Left + Slovak National Smer +
HZDS
50% These two coalitions depend both on the ability of Smer’s coalition partner to get into parliament and on the absence of at least one (or more than one) other party to provide the necessary seats for a majority. It appears that these coalitions are not viable if both Hungarian parties make it into parliament.
Smer +
SNS
75%
Left + Slovak National + Hungarian National Smer +
HZDS + (MKP-SMK or Most-Hid)
50% It would theoretically be possible to add one one Hungarian party to a Smer and HZDS (but not Smer and SNS) coalition, though worsening relations make this increasingly unlikely. Fico would have to be desparate to chose this option, but if trends continue he may indeed face relatively few options.
Left + Hungarian National Smer +
MKP-SMK or Most-Hid
100% The members of such a coalition are almost certain to get into parliament (it is highly unlikely that both Hungarian parties will fail), but it only becomes really viable if the other Hungarian party does not make or if both SNS or HZDS fail. Fico may, however, have a hard time forming a coalition with a party (MKP-SMK) that has become the most recent direct target of his campaign.
Smer +
MKP-SMK + Most-Hid
60% This coalition would have a clear majority but it is only as likely as the weakest of the Hungarian parties getting into parliament. It is also highly unlikely that Smer would opt for two feuding Hungarian parties (a recipe for disaster) if he could manage any other coalition.
Left + Right Smer +
KDH
100% This coalition–which is almost certain to have both members in parliament at levels that produce a majority–actually stands in for any coalition between Smer and one of the current “right wing” Slovak parties. But it is almost impossible to imagine either of the members of this coalition wanting to do this, since both would not suffer with their supporters and especially since KDH unconditionally excluded the possibility and Smer excoriated KDH in response.
Right + Hungarian National SDKU + KDH + SaS +
MKP-SMK + Most-Hid
60% This coalition would probably have enough votes for a majority (though if both Slovak national parties enter parliament that is in question) but it is dependent on both Hungarian parties entering parliament which is far from a sure bet. Several months ago this coalition did not seem likely to have a majority. Today with declines in the Smer and increases in SaS it has become plausible. The recent citizenship-law issue, however, raises questions about the acceptability of MKP-SMK for the Right that are difficult to answer at present.
SDKU + KDH + SaS +
(MKP-SMK or Most-Hid) + HZDS
100% If one Hungarian parties does not make it into parliament, there is still a chance for it to come close to a majority but only two of three of the parties currently on the line fail. Interestingly a failure by one of the Hungarian parties actually helps magnify the chances of a coalition including the other, making the current sharp competition between the two Hungarian parties more rational than it might seem. If we see a continuation of the emerging differentiation between MKP-SMK and Most-Hid related to Hungary’s dual citizenship law, then only the variant involving Most-Hid becomes viable, but this, of course, would depend on Most-Hid actually making it into parliament.
Right + Hungarian National + Slovak National SDKU + KDH + SaS +
(MKP-SMK or Most-Hid) + HZDS
50% If both Hungarian parties do not make it into parliament, the current opposition could theoretically top it off with HZDS but this is unlikely since SaS and KDH have expressed reluctance to join with HZDS and it is in any case dependent on HZDS making it into parliament (at best 50-50). This unlikely option is probably Meciar’s last chance to play kingmaker before the end of his political career: if both SNS and HZDS enter parliament, then HZDS’s choice matters; if SNS does not make it, then the likely coalition combinations to not offer much hope for Meciar to play any role. This is the way the [party] may end, not with a bang but with a whimper. (If, however, the current right parties continue to distance themselves from SMK, Meciar’s bargaining power increases slightly as he could offer his party as an alternative to SMK in a coalition with Most-Hid)
SDKU + KDH + SaS +
MKP-SMK + Most-Hid + HZDS
30% There is a slight chance if all of the current major parties succeed that this coalition of all current opposition parties and HZDS would be theoretically possible alternative, but its likely that some other smaller combination would still gain a majority.

Or we can look at it another way: What are the consequences for coalition and government formation depending on who crosses the threshold and who doesn’t:

Who’s missing from parliament: Likelihood of scenario: Possibilities: Most likely government
No one 23% If all of the major parties make it over the threshold, these numbers give roughly equal numbers of seats to the current coalition and the current opposition (plus the two new opposition parties). One of these might just get enough seats to govern. If there is a perfect deadlock, a government would require one party to switch slides. This is becoming increasingly unlikely and could lead to a Czech Republic scenario of weak, bare majority or minority governments until the disintegration of one of the parliamentary parties (not impossible in current circumstances) allows for a new configuration or new elections. Current coalition or current opposition
HZDS 23% If either HZDS or SNS fail to make it into parliament, then the current opposition actually has a chance at a majority coalition given the current estimates. Alternatively Smer could try and pry either KDH or one Hungarian partys away from the current opposition but it is hard to imagine the magnitude of promises this would take to get them to leave a more ideologically consistent, if far more ungainly coalition of opposition parties. The dynamic chances if MKP-SMK becomes anathema to both sides, in which case there is no clear majority for either side. Current opposition
SNS 8%
HZDS & SNS 8%
One Hungarian Party 15% If one of the two Hungarian parties is the only one not to make it into parliament then the stage is set for a continuation of the current coalition or force some sort of cross-the-lines coalition such as the (now ruled out) Smer-KDH coalition or the ungainly coalition of the current opposition plus HZDS. The latter might be possible if the it is MKP-SMK that falls below the threshold, but the numbers make the slightly less likely of the two scenarios. Current coalition
HZDS & one Hungarian 15% If one Hungarian party fails and one of the Slovak national parties fails, there are a variety of possibilities very close to a majority: Smer+SNS, Smer+the Hungarian Party, or the current opposition. Current Coalition, current opposition, or Smer plus a Hungarian party
SNS & one

Hungarian

5%
HZDS & SNS & one Hungarian 5% If a Hungarian party fails and both Slovak national parties fail, then it will again come down to who–if anyone–can (and is willing to) draw the remaining Hungarian party. The current opposition would have the upper hand here, but would they take it? Current opposition

Any way we slice it, it looks as if the thresholds will be key. More than half of the coalition possibilities rely directly on parties that are just on the threshold of survival and those that do not are still dependent on threshold effects to determine whether they will muster a majority and whether there are coalition possibilities that may be more attractive to some potential members. We will not have a very good idea of what is even possible until we the results are in. The announcement of KDH’s exclusion of Smer at the beginning of the week led me to think that there may not be quite as much coalition speculation as in the past because of the hardening of opposition-coalition lines, but the increasingly sharp reaction of both Smer and SDKU to MKP-SMK’s position on the Hungarian citizenship law may bring us back to a position of active coalition jockeying but as the case of the Czech Republic shows, government coalition-making gets much harder if one major party is not coalitionable.

Polls, Parties and Politics, Part 7: How (not) to help voters translate preferences into votes

Poznamka:  Vitajte!  Prepac, ze vsetko tu je len po anglicky ale 1) moja slovencina je bohuzial slaba a 2) mnohe z mojich citatelov nehovoria po slovensky.  Prepac.  Mam, vsak, “google translate buttons” na pravej strane (bohuzial grafy a tabulky su len po anglicky.  Ak chcete preklad, daj vediet: pozorblog@gmail.com alebo nechaj “comment”).

Poznamka II: HN uz publikoval slovensky preklad (neviem kto to robil, ale dakujem): http://hnonline.sk/slovensko/c1-43853830-kovac-junior-sa-uniesol-sam-volim-hzds

In recent years thanks to interactive web technologies, a variety of news outlets, civic groups and party organizations have begun to create online tests to help voters figure out the relationship between what they want and the party that most closely fits their ideological preferences (for example http://www.quizrocket.com/who-should-i-vote in the US, http://www.selectsmart.com/FREE/select.php?client=GLAR in the UK, and most recently and impressively, http://www.euprofiler.eu/).  This trend has finally made it to Slovakia in the form of “Voličomer“, Pravda’s voting test which asks “How will people with similar opinions to yours vote?  The same, similar or completely different?  Fill out this questionnaire and you will find out right away.”

What I found out right away is that Voličomer leaves rather a lot to be desired:

  • The first time that I filled out the survey, I tried to exhibit the profile of a European social democrat, the party family closest to my own:  moderately statist on economic questions and liberal on cultural questions.  What came up first on the list, however was the Communist Party followed by the tiny HZDS-splinter AZEN, though with with a variety of other left wing parties nearby including Smer.  I was willing to accept this result as reflective of the absence of cultural liberalism from most left wing parties in Slovakia (though I have a hard time believing that the KSS is the closest alternative).   
  • I then tried to fill out the survey as a supporter of Slovakia’s opposition.  Here the results were rather good, with SaS coming first and SDKU coming second on the list, though oddly with AZEN again appearing near the top of the list.
  • My next effort was to to represent a member of one of the Slovak national parties, with criticism of both Hungarians and Roma and mixed answers on economic questions that are less important for such voters.  The result was below.  As with my social democratic effort, an extreme party popped up first–the radically xenophobic NS–followed by Meciar’s HZDS and the Slovak National Party.  But in between HZDS and SNS appeared the Party of the Hungarian Coalition, MKP-SMK!  It is virtually impossible for me to think of any meaningful quiz in which these parties appear next to one another except on in which the adjectives “Slovak” and “Hungarian” are erased and respondents are simply asked about the intensity of their national feeling (which would be an interesting exercise but it is not what Pravda is trying to do with Volicomer).  
  • A second attempt to represent a supporter of a Hungarian party produced an equally odd pattern that included, in the top five, two HZDS splinter parties (ND and AZEN), the Christian Democrats (KDH), the Party of the Hungarian Coalition (MKP-SMK)–but not until third place–followed in short order by an obscure worker’s party (ZRS), Smer, the Roma party and the radically anti-Roma NS.

The problem here is that Volicomer does not seem to be set up in a way that could produce a meaningful answer except in certain circumstances or by accident.  Setting aside the fact that like almost all such tests Volicomer is based only on policy questions and not on relevant circumstances such as who respondents voted for in the past or their affection for individual politicians, its failure to identify party preference has more a fundamental cause in its failure to deal with the linked questions of underlying issue dimensions and their salience.

Issue Dimensions

Voters’ answers to political questions tend to form a limited number of reasonably well-defined clusters, (in which case an individual’s answers each of the questions is, theoretically, fairly closely related to the answers o the others).  The content of these clusters varies from country to country and from one decade to the next, though most countries have long-lasting oppositions between pro-market and pro-state clusters on economic questions and many have similar clusters on cultural and religious questions, questions of foreign policy, regional and language policy and other sets of issues (for far too much detail on this question, see http://www.la.wayne.edu/polisci/kdk/papers/cleavage.pdf).  In some countries all the major political questions are more or less reducible to a single cluster, so that we can speak of  one-dimensional political competition.  In most, however, knowing voters’ or a parties’ position on one did not help guess positions on the others, producing two or three relatively independent dimensions.  (One of the core messages in my own courses on American politics is that despite our obsession with the all-out war between “liberal” and “conservative,” there are at least two dimensions in American politics: one economic and the other cultural.  For far to much detail on that question see http://www.pozorblog.com/2010/03/american-politics-in-a-nutshell/).

In Slovakia, I have argued, competition is at least two-dimensional.  With an economic dimension and a national dimension.  These have sometimes overlapped considerably but at other times have been almost completely unrelated, producing a two dimensional axis such as this graph that I’ve used in other settings:

This gets a bit complicated, of course, because “nation integrating” means, “Slovak nation defending” and its rival pole is not so much “Slovak nation integrating” as “Hungarian nation defending” but I simplify it here because the main area in which Hungarian parties and Slovak parties agree on this side of the axis is the need to integrate Slovakia into European structures.  Regardless of their labels, the important question is the degree to which these axes are independent of one another or somehow aligned so that positions on one are closely related to positions on the other.  This is an open question in changing circumstances.

I have some thoughts that in fact political competition in Slovakia is not defined by two dimensional but actually contains at least two additional “half” dimensions.

One of these is cultural, not in the national sense but in the religious sense and relates to issues of church and state and traditional morals.  The dimension seems to be at right angles to both of the others, forcing the inclusion of a third dimension on the graph, but unlike the others two dimensions, the distribution of people and parties on this dimension is quite asymmetric, with a relatively small share on the side of the church and traditional moral and the bulk of the population and the party system on the other side.

A second half-dimension, more speculative, is one that Tim Haughton and I have identified in Slovakia and other countries in central and eastern Europe: a “novelty” dimension.  We have argued that there is a relatively stable (if not dominant) bloc of voters who seek less corrupt governance and who seek new, untainted parties to achieve the goal, but who are invariably disappointed when those parties themselves become corrupt.  Thus although the dimension remains stable, the players on the “New and ‘clean'” pole are constantly changing.  Parties such as ZRS (1994), SOP (1998), ANO and Smer (2002), SF (2006) and today’s SaS and Most-Hid have at their peak occupied the “new and ‘clean'” end of this axis but slip gradually to the other end and, with the notable exception of Smer, which found other issues on which to build its base, disappear from political competition.

Which brings us back to the Volicomer question.  It is virtually impossible to understand the role of programmatic issues for party choice without a clear understanding of how those issues cluster together, how many clusters there actually are and how they are related to one another.  Except in certain circumstances, a simple additive list will ultimately produce gibberish (as Volicomer does on anything other than the economic dimension where the plurality of its questions are concentrated), while the best political quizzes begin with the question of dimensionality (see Idealog, http://www.idealog.org/, and Political Compass, http://www.politicalcompass.org/).

Salience

Even a quiz designed to account for Slovakia’s two-and-two-halves dimensions of competition will not produce particularly meaningful results unless it also accounts for the salience of the issue clusters.  All parties and voters emphasis that parties and voters place on them clusters when making their political decisions and these are not the same form party to party or from voter to voter.  In Slovakia in particular, those who tend to care about national questions put relatively little emphasis on other clusters of issues while those interested in economics usually put national questions in the background.  Knowing a person’s positions on issue dimensions, therefore, is important only if you know which of the dimensions is most important for that person.  By asking a high number of economic questions, Volicomer privileges the economic dimension and therefore produces acceptable, if not particularly useful results on that dimension while failing to produce anything meaningful on issues that are restricted to one or two questions.

Volicomer2: A (not so) Facetious Alternative

But things like Volicomer are hard to do, you might argue, and I should accept it as better than nothing unless I am willing to do the work to provide a better option.  Challenge accepted.  In the spirit of the old television game show “Name that Tune” (which I have never actually seen but which was part of the pop culture of my upbringing), “I can name that party in 4 notes.”  The flowchart below is a not-so-serious (but not entirely frivolous) attempt to integrate issue dimensions and salience to reduce the number of questions necessary for picking the major parties (and for the smaller parties the choice is largely random in any case):

Even a cursory look at the flowchart reveals the assumptions that I use when approaching Slovakia’s politics:

  • The “National Question” is the most polarizing and those who care about national issues are unlikely to care about much else.
  • The “National Question” is largely distinct from the economic questions, though those who care a little bit about national questions are more likely to prefer a statist economic policy (hence the “a bit” option that points to the choice between Smer and HZDS.  This was not always the case but the two axes have slowly come into closer alignment).
  • The choice between MKP-SMK is largely a personality driven one and therefore largely unpredictable on other bases.
  • The choice between SDKU, KDH, and SaS is one based on religiosity in the first case and novelty/”cleanliness” on the other.  In other words the two half-dimensions currently function primarily within the right wing of the political spectrum.  My guess is that by the next elections there will also be a “new party” alternative within the left wing that will siphon some votes from Smer, but we will have to wait to see about that.

I’m not convinced I’m right about any of this, so I’d encourage everybody who reads this to try Volicomer, try the quiz above and see which works better.  On this, as with everything, I’d love to see a larger number of reader comments!

Polls, Politics and Parties, Part 6: How (not) to second guess the polls…

Two-and-a-half months ago I finished up a blog post on poll predictiveness with a cliffhanger:

This question has driven experts to find a variety of proxy measures to figure out how to adjust polling numbers to reflect the final outcomes.  This post is already too long, however, so that will have to wait for another post.

By now readers have no doubt forgotten that they have been hanging on in suspense and have moved on to other important things, but I have not forgotten the promise.  Indeed I could not since this is one of the two biggest questions that shape how we look at poll numbers in Slovakia (the other is the threshold, which I will deal with in the next part of this series) and since the issue has surfaced in nearly every major Slovak daily.  No refer to just a few:

Each of these articles refers to methods by which one might try to put poll numbers in context, with the ultimate goal, the grail, to make a better prediction of election results.  On the one hand some articles, such as the most recent one from SME, say that this can’t really be done–that it depends too much on idiosyncratic behaviors and random events.  Other articles, such as the one in Hospodarske Noviny suggest that the firmness of voter commitment might offer some clues that would allow us to make better predictions.  Others have suggested factors such as voter turnout likelihood, measured either by surveys or by past polls.  Recent trends may also play a role in shaping how people decide when they actually enter the voting booth.  These all seem plausible, but rather than take any of these potential influences as real, it is worth testing them to see if they do have any relationship to the difference between polls and actually election outcomes.

The Role of Voter Loyalty

It seems quite plausible to assume that for two otherwise identical parties, the party whose voters are more committed to voting for it will perform better.  It seems plausible, the,  that polls (which usually don’t ask about degree of committment) will tend to underestimate the election-day performance of parties with more committed voters.  And this should give us a tool for making better predictions.

But it doesn’t.

At least it didn’t in 2006.  Below is the first in a series of graphs that looks at the relationship between potential sources of “poll adjustment,” such as “voter committment,” on the x- or horizontal-axis and the actual predictiveness of polls (specifically the difference between election results and poll results) on the y- or vertical-axis.  If a source of adjustment is useful, the graph should follow a straight line between lower left and upper right (in other words, parties which score “low” on whatever factor also underperform polls while parties that score high overperform polls).

The graph for “voter loyalty” (measured here as the difference in a March FOCUS poll between those supporters of a party who say they will “definitely” vote for the party and those who say they “might change” their minds) suggest that this data source does not allow us to improve our assessments.

In fact, there is a slightly negative relationship between loyalty and support.  The factor of loyalty might help explain why the longstanding SMK did better than expected and why the relatively new and weak SF did worse (which, if true, might suggest a discounting of current preferences for SaS), but it does not explain the overperformance of SDKU (except to the extent that SF voters may have shifted to that party, something not factored into the “loyalty” question).  More to the point, perhaps, it also does not explain the underperformance of HZDS, which in 2006 had the most loyal voters of all.  “Committment” may have something to do with it, but if it does, the interaction is too complicated for this single piece of information to produce any meaningful insights.  So HN may be right in pointing out that KDH voters are the most “solid” but that does not help much.

A related factor–perhaps very closely related–was cited by ING Bank in its own quite thorough 2006 analysis of the prospective election results which circulated before the elections.  The bank’s report, which unfortunately did not contain full footnotes, cited two measures of voter “discipline” and compared the share of “disciplined” voters committed parties to the share of voters overall.  Here again, a party with more “disciplined voters” should in theory have a better chance of outperforming the polls than a party with fewer disciplined voters.  Unfortunately, I do not know how they defined “disciplined” and I have a feeling that it is simply another way of calculating the same “loyalty” data above.  Since I don’t know whether it means anything, I analyze the results here only to demonstrate that the same results emerge for polls by both FOCUS and MVK (and therefore that this is not simply an artifact of FOCUS polling).

The trendlines here are essentially flat, suggesting no relationship.  The MVK results have a slightly positive trend, but not by much and the overall pattern is murky: again it works for SF and, with MVK, for SMK and SDKU but not for SDKU in the FOCUS survey or HZDS in the MVK survey.

The Role of Party-Voter Turnout

The voting decision is actually twofold: alongside the question of whom to vote for is the question of whether to vote at all.  The preference question itself does not measure whether those who prefer a party will actually make it to the polls on election day.    In theory those parties with voters who were more likely to go out and vote would do better than others and therefour outperform the polls.  We have data on this because in 2006 the pre-election FOCUS polls regularly asked about likelihood of participation.   The graph below combines the results for all major parties over four months and shows the relationship-line for the February data, the May data and the data for all four months aggregated together.

As with the loyalty data, the trendlines here point down, suggesting that knowing the likelihood of voter turnout for a party does not help figure out whether the party will perform better than the polls.  This figure works for the same parties as loyalty–SMK in the positive, SF in the negative–and fails for the same parties as loyalty–SDKU and SNS  outperform likely turnout while HZDS underperforms.  Of course there may be a reciprocal relationship here between SDKU and SF and between SNS and HZDS, but the point here is that the loyalty and turnout figures alone do not tell us that information and cannot be used to specify our predictions.

Previous Polls

An even more direct way to estimate the overperformance or underperformance of parties compared to polls is to look at the performance in the previous election.  In 2006 I set out to create a prediction model based largely on this principle, looking at the gap between past polls and past actual results using the 2002 Slovakia parliamentary election and 2004 Europarliament election and suggesting a relationship between differences in turnout (medium in 2002, very low in 2006) and differences between party polls and party performance.   The model did not work.  Or more precisely, it worked so idiosyncratically that it was not useful:  it worked well for SDKU and SF and badly for most of the rest.  The graph below demonstrates the weakness of that attempt: the

The graph shows two sets of dots because there is a slight comparability problem:  in 2002 the law forbade polls within the last two weeks of elections whereas in 2006 it did not.  The graph above shows differences between polls and results as a percentage of the poll figures in 2002 compared to 2006 for both the 2006 polls taken immediately before the election (white circles and colored rims) and those taken in a more comparable 2-4 week period before election (colored circles and gray rims).  In both cases, the results are the same:  predictiveness of polls in 2002 did not help assess predictiveness in 2006 except for SDKU, SMK and Smer (but only the 2 week prediction and  not the election day prediction).  It would appear that too many other variables affect the parties and polls over time for this method to work well.

What we need, then, is some kind of indicator that itself incorporates a significant share of the factors that shape poll predictiveness.

Oddsmakers and Experts

One way of assembling and integrating relevant factors is to find a smart and trustworthy person who has already done it.  It is even better if the person (unlike the author of this blog) stands to lose some tangible resources if the predictions are wrong.  There are not many public sources for this kind of information for Slovakia.  Political scientists, pollsters and journalists (precisely because they do have something to lose–reputation and perhaps even revenue) tend to keep their predictions to themselves.  And there is not yet a widespread public odds market in which individual buying and selling of shares offers a glimpse into public assessment of probabilities (a mechanism which has been extremely effective in predicting close races in the United States) except in SME‘s ambitious effort, which at least for now does not seem to involve real losses or gains or a particularly large base of participants (though that does not mean that the collective wisdom of SME‘s readers won’t be correct, and the consensus I see there is not implausible) .

What we have instead are two rather thin reeds: in 2006 the firm Tipos.sk allowed public betting on election questions, though the odds were established by the bookmakers themselves and only occasionally updated rather than in a true shares market (and which can be reverse-engineered into an assessment of the bookmaker’s own predicition); and in that same year an assessment by an analyst at ING Bank became public (though not necessarily with the encouragement of the bank).  I am sure there are other analyses floating around by political risk mangement firms, but I don’t have access to them (though if readers do and can share them, even for past elections, I would be extremely grateful).  The question is whether these expert opinions do much better than the raw data.  The answer is no, as the chart and graph below show.  In only 4 cases out of 16 did the expert opinion do better than the actual final polls in predicting the outcome (and in this cases for the likely suspects:  SF, with its weak base, and SDKU with its past history of significant underestimation) while in 7 of 16 cases the expert opinion did rather worse than the actual data.  Of course these analyses emerged more than a month before the actual election and, to be fair, they actually performed slightly better than the poll estimates from May polls, so experts do have their (slight in this case) value for those needing their predictions well in advance.

Party Actual 2006
election result
Actual results minus pre-election estimates
Final week
poll average

Tipos odds

ING Bank

HZDS 8.8 -2.7 -3.8 -3.7
KDH 8.3 -1.4 -1.3 -2.8
KSS 3.9 -1.2 -1.1 -0.9
SDKU 18.4 5.4 3.8 2.4
SF 3.5 -1.9 -1.0 0.3
Smer 29.1 1.5 4.2 4.6
SMK 11.7 1.4 2.5 -1.8
SNS 11.7 1.6 3.7 3.9
Average error in raw points 2.1 2.7 2.6
Average percentage error 21.7% 25.7% 22.5%

The best tool I can find: Pre-election trends

In the process of testing all of these various mechanisms for prediction, I decided to try one last method:  does a party’s trajectory actually affect its final outcome?  In this case the theory suggests it should not have much of an effect:  when polls are taken up to the last minute, then trends themselves should not shape the final decision.  It is possible, however, that a voters’ sense of trend might bring a reluctance to vote for a declining party or an enhanced willingness to vote for one on the rise.  And lo, when I ran the numbers the results came out shockingly clear:  in 2006 a party’s trendline for January through April had a clear relationship to the party’s tendency to over- or underperform polls:

This source of information correctly predicts 5 of the 8 and incorrectly predicts only 2 (and then only by narrow margins).  The dots are grouped tightly around the line, suggesting a strong relationship.  It is as if the election results followed the trendlines, but at levels they would have produced in July or August rather than June; the experience of going into the voting booth may force the kind of concentration that pushes voters to become the extrapolation of trends.

A strong caveat: I am hesitant to take this too far, especially since I have not been able to put together a time series for previous elections or in other countries, but the initial results suggest that the past trend is something worth attending to.

A word about prediction, caveat be damned. So what would this flawed (but not as flawed as the other methods I’ve looked at here) say about Slovakia’s upcoming 2010 election?  Well it is necessary to begin by looking at the 2010 four-month trends.  There are, of course, several ways to calculate the trend, averaging individual poll trends or aggregating all poll data together.  The results and relative positions of parties are reasonably similar, however.  The following table gives the range:

Party Trend Change
SaS Significantly positive +60% to +80%
KDH Moderately positive +10% to +13%
SMK Slightly positive +7% to +11%
MOST Slightly positive +2% to +8%
SNS Mixed -5% to +8%
SDKU Flat 0% to +1%
Smer Moderately negative -10% to -12%
HZDS Significantly negative -10% to -23%

This is good news for SaS (especially since if the question of “loyalty” and “discipline” are relevant anywhere it is for new parties such as SaS whose positive trend here may be enough for it to overcome the at-the-polls reluctance that kept SF from parliament in 2006) and not bad news for KDH, though this party seems locked into a 9.5%±1.5% performance zone regardless of external circumstances.  The news Smer is not good–but this is not unexpected, since the even party elites know that their party gathered a significant amount of soft support during its more successful years–but not catastrophic since Smer has a huge lead over the next largest party.  The worst news is for HZDS which has both the strongest negative trend in recent months and the least cushion to offset any losses.  If the trendline factor found in 2006 applies in 2010 then HZDS will not make it into parliament.  A big if.

For the other parties the prediction is far less clear.

  • I suspect this model does not apply at all to Most-Hid and SMK since the intra-ethnic competition takes a quite different form.  Of course this makes all of the above assessments rather useless since this is what everybody wants to know.
  • For SDKU the neutral trend is probably about right.  In the past the party has benefitted from last minute decisions by voters to stick with the tried and true on the right.  With a revived KDH and a solid alternative in SaS (barring any mistakes by the party or revelations about it in the next month), SDKU will likely not see the big jump that it saw in 2006 or 2002.  Its has a good chance of being the strongest of the right-wing parties, but probably not by too great a margin.
  • As for SNS, it is an open question.  In the last four months, SNS saw a general decline offset by a major rise in a single poll: FOCUS in April.  Take out that one data point and SNS shows a trend in the last four months that matches its sharp decline over the past full year.  It is for that reason that I am keen to see the April Median poll–not for level but for trend–and especially the May FOCUS trend.  If FOCUS in May puts SNS back under 6% then the party may be in real trouble.  The threshold will have a big impact on the shape the next government (the topic for the next post, I hope.)

Polls, Politics and Parties, Part 5: Who with Whom? Doing the coalition math

coal allWith 8 parties potentially entering Slovakia’s parliament there are 255 different coalition possibilities.  Fortunately, not withstanding Bismark’s aphorism that “Politics is the art of the possible,” there are quite a few coalition possibilities that we can exclude and in the end we can narrow down the possibilities to a relatively small number.  In the paragraphs below, I do this as systematically as I can by excluding (with great care) individual relationships that simply will not work and ranking others by probability, and then with guesses about which of the remainder will manage to muster a sufficient number of seats.  Those who don’t want to read the whole process by which I reached the answer can jump down to the bottom and look at the pretty graph:

Coalition (im)possibilities: What can we exclude?

I heartily accept Charles Dudley Warner’s conclusion that “Politics makes strange bedfellows” and I am no longer surprised when lifelong enemies join forces against a new opponent, so it is a dangerous business to say that “Party A” will not form a coalition with “Party B.”   In fact, as I learned the hard way, it is still a dangerous business even when the leader of “Party A” has said it himself.  For example:

(HZDS leader Vladimir) Meciar only ruled out post-election cooperation with the Slovak National Party (SNS). “This is because of its low political culture, vulgarism, and inclination toward unethical behavior, and I cannot cooperate with Jan Slota (SNS leader).” Sme, Tuesday, April 11, 2006 T08:49:17Z:

Since this statement led me to discount the combination that emerged 3 months later and that has governed in Slovakia during the past four years, I now think it wise to seek out other standards.  What leaders say can be helpful but only if backed up by something else.  Unfortunately, that something else is the rather insubstantial notion that barring alien invasion, some parties very reasons for being exclude coalitions with other parties and whose electoral existence would be threatened by the combination.  There are only a few of these:

  • Slovak National and Hungarian National:  It is hard to envision a coalition between the Slovak National Party (SNS) and the Hungarian parties, Most-Hid and MKP-SMK.  It would be very hard for the Slovak National Party to accept partnership with parties it tried to ban, even if the Hungarian parties were willing to accept.
  • Left and Right:  It is hard to envision a coalition between Smer and Freedom and Solidarity (SaS) or the Slovak Democratic and Christian Union (SDKU).  This one’s a bit less certain because the economic dimension is not quite as bitter as the national one, but from its beginning SaS pointed to Smer as its chief opponent and differentiated itself from other parties on its same side of the political spectrum (especially SDKU) precisely on its unwillingness to form a coalition with Smer.  For an older, more established party, it might be possible to go back on the promise, but SaS doesn’t have too much else to offer.

coal1This reduces the range of party relationships a bit and drops the total number of coalition permutations to 119:

The next step is to eliminate combinations that are highly unlikely, on the basis of leader statements backed by some fundamental opposition that would cost a party major support if it joined with another.  Here I would suggest several candidates:

  • Right and Slovak National: KDH, SDKU and SaS are highly unlikely to form a coalition with SNS.  It is not impossible that right-wing parties might join with SNS, but it is hard to imagine the circumstances.  SNS has used such strong national rhetoric and has faced so many corruption allegations that even Smer has found the combination difficult.  For the right wing parties, whose voters are less nationally oriented and who are likely more sensitive than Smer to the opinions of international partners, the combination would be even more difficult.  Furthermore, any seats that SNS would bring to a right-wing coalition would be more than offset by the loss of any possibility of Hungarian seats.
  • Let and Right: It is also hard to envision a coalition between Smer and SDKU.  At one time the combination seemed utterly impossible given Fico’s hatred for Dzurinda; now that Dzurinda will no longer be the electoral leader of SDKU, it might be a bit easier, but Fico has just as much disdain for one of the leading candidates for SDKU leader–Miklos–and the other leading candidate, Radicova has recently sharpened her rejection of this kind of coalition.

coal2Since coalitions can occur only if all parties are willing to pair with all others, this drops the number of permuations to a (slightly) more reasonable 83.

In addition to these, there are a number of hard relationships, those which would be made difficult either by personal animosity or by potential loss of support.  This category—where I should have placed HZDS-SNS in 2006—is a bit larger but doesn’t help us much as it merely raises the cost of coalitions rather than preventing them altogether.  Still, these combinations are worth noting as “expensive”

  • Right and Slovak national.  It is not impossible to exclude a coalition between HZDS and KDH, SaS, MKP-SMK and Most-Hid, but past conflicts between HZDS and the right and Hungarian national parties are still vivid enough that such a coalition, while possible, would not be easy.  KDH in particular has resisted any connection with HZDS but the Hungarian parties are also disinclined.  SaS leader Sulik has moved from a statement that a coalition with HZDS would be a lesser evil, to a statment that HZDS leader Meciar should be “behind bars.”
  • Left and Right.  The only left-right coalition not excluded above is Smer with KDH.   This is the one that is merely unlikely rather than hard to imagine.  The coalition would be hard to accept for Smer voters and especially hard for KDH voters.  Recent comments by KDH chair Figel about Smer are sharper than in the past and a coalition would likely hurt KDH with its supporters, but it can’t be excluded entirely.
  • Left and Hungarian national.  Both Hungarian parties, for their part, seem desirious enough of entering government that they would probably be able to overlook Smer’s past rhetoric on national questions but Smer has put a lot of energy into criticizing Hungarians and so would find it difficulty (though probably not impossible) to choose a Hungarian partner as it would lose a relatively strong electoral appeal.  Since, as below, Most-Hid and MKP-SMK are not getting along well at the moment a coalition between Smer and only one of the Hungarian parties would be slightly less fraught, but might be no more desirable to Smer and would have a lower chance of gaining a majority.
  • Hungarian and Hungarians.  Ultimately a conclusion may well include MKP-SMK with Most-Hid but doing so will take some work as the leaders of the two parties dislike each other intensely and the rhetoric has becoming sharper.

coal3

We can also do a preliminary assessment of the mathematical possibilities of coalitions, using a maximalist version of current party support.  A coalition of SDKU and SaS might work nicely but the party has no practical chance of a parliamentary majority.  We can exclude electorally impossible coalitions by taking current poll results and (for safety’s sake) giving each party a 30% bonus (assuming maximal poll error in a party’s favor).  This brings the number of even barely viable coalitions down to “only” 27.

From this, furthermore, we can remove 7 coalitions as containing redundant members (eliminating the smallest still leaves more than 80 seats by current estimates).  This brings us down to 19.

Coalition possibilities: What’s left:

For simplicity we can further categorize these coalitions by similarities among members.  The graph below tries to makes sense of these many options by comparing them along two axes:  from left to right a internal compatibility of coalitions (related to the “expensiveness” of coalition pairings discussed above but based on my own highly-arguable judgment rather than any quantitative measure) and from bottom to top an expected number of seats based on current month polls.  Least likely coalitions are in the lower left; most likely in the upper right.

coalition matrix

The coalitions in terms of likelihood are, therefore:

  • coal lsnSmer + Slovak National:  From an electoral perspective, the current coalition has a strong chance of return, and is not utterly unpalatable for the coalition members.  Slightly more internally compatible would be a subset of the current coalition—Smer with either HZDS or SNS—but this has a somewhat lower chance of sufficient electoral success.
  • coal lhnSmer + Hungarian National: A coalition between Smer and both Hungarian parties is electorally possible but less mutually desirable by its member.
    • Smer + Hungarian National + Slovak National: Adding HZDS to this mix is theoretically possible but probably would not be necessary in electoral terms and would add consideral internal incompatibility
  • coal lrSmer + Right: It is hard to imagine a coalition between Smer and a “right” party except KDH and even this would be unappetizing for Smer (though perhaps moreso than a coalition with Hungarian parties) and even less so for KDH.
  • Right + Hungarian National: A coalition resembling the 2002-2006 Dzurinda government is coal rhncertainly a possibility in terms of internal compatibility (these parties conflicted with one another when in government but seem willing to tolerate one another rather than see another Fico government).  From an electoral perspective, however, these are highly unlikely.
    • Right + Hungarian National + Slovak National: Adding HZDS to this coalition could perhaps coal rhnsnpush this coalition into a parliamentary majority but only by adding so much internal incoherence as to make it highly unlikely.  It is hard to imagine what incentives could inspire HZDS to chose this coalition rather than one with Smer but the party is certainly relying on having more bargaining potential than SNS, for whom Smer is the only coalition choice.

Both of these are only very rough indicators of the actual factors (coalitionability and electoral strength) but they are the best I can come up with at the moment.  I will try to nuance these as the election nears.  One nuance, worth thinking about now, however, is the fact that Slovaka’s electoral system does not make a smooth equivalence between seats and votes but rather imposes (as most countries do) a 5% threshold.  Since 5 of Slovakia’s 8 major parties have support near 5%, a small change in support can have major impact on the composition of parliament and these deserve consideration in the next post.

Polls, Politics and Parties, Part 4: Poll Predictiveness by Party, Pollster and Time

p16How well do public opinion polls in Slovakia predict election outcomes?  Well as the previous post suggests, not too well.  But they’re all we’ve got.  Of course we could always wait until the future comes to us, but, frankly, where’s the fun in that.  So rather than sit around and wait or make faulty predictions, we can try to figure out where and when the data we do have is most useful.  We can get a bit more mileage out of the data if we understand its strengths and limitations on three dimensions: time period, pollster and party   (It is theoretically possible to go further and divide it by categories within the surveyed population, but that requires the original data which is available only for limited periods and certain pollsters and so I will hold off on that for the moment.)  It is no surprise that recent data is better than old data, but even that generalization has its limits.  And while we can’t assume that polls will err in the future in the same way as in the past, it is important to know where the diversion between poll and reality crept in.

Time: Polls get better closer to elections.  Sort of.

As we elections near, shouldn’t polls become more predictive?  Yes, but not in a purely linear fashion.  I do not have a lot of data on this–only 3 elections, two of which were for the European parliament–but what I do have suggests that increases in predictiveness really only begins about 6 months before the election.  The graph below shows the differences in raw percentage points between poll “predictions” and actual results extending backward from election day.

Predictiveness of average poll results or major parties, approaching election

Predictiveness of average poll results or major parties, approaching election

There is quite a bit in these finding are news to me:

  • Improvement is not linear. I did not expect the “reversal” that occurs between one and two years out in each case–such that in each elections predictions made about 500 days before the election would be better than those made 200 days before the election.  Of course it is impossible to predict on what day to make the best predictions (for Slovakia’s parliament in 2006, T-500 days was better than T-700 or T-200, but this was not true for the 2009 Euroelections.
  • Europarliament predictions do not get better over time; Slovak parliament predictions do. Nor did I expect, though I should have, that predictions in Europarliament elections actually don’t get any better over time.  This is clearly related, I think, to the low voter turnout in Euroelections.  In this case the polls are considerably more representative than the elections themselves.  The results for Slovakia’s parliament, by contrast, have plateaus and valleys but do get closer to actual results with time.  (And one small footnote:  I worried that the results above were the result of differences in polling patterns: Slovak parliamentary elections have more polls and might therefore be more accurate.  But when I re-ran the numbers with only a single polling firm–UVVM–I got essentially the same results, suggesting that the patterns do not depend on the polling density).
  • Sharp increases in predictiveness come in the last 150 days. For two of the three polls, the best increase in accuracy came in the final five months and since today we are at entering month 4, we are already in that period.  Using these models (a rather thin basis for comparison) we could guess that we are just leaving the period of relatively low predictability and so any judgments made on the basis of polls to date should be taken with some care.  By a month out, we can make guesses about the final result that are not overwhelmingly different from the final rush of polls.  That’s not true today.

Pollster: Some firms are better than others, but not by too much

The second big question of accuracy depends on the pollster.  It may be that some firms are simply better than others and that to average them together is to inject unnecessary noise.  The graph below shows the errors in poll predictivness for each major polling firm’s final pre-election survey in four elections:  Slovakia’s parliament in 2002, Europarliament in 2004, Slovakia’s parliament in 2006 and Europarliament again in 2009.  Gray boxes mark “final” polls taken more than a month before the election.

Poll predictivness by pollster 2002-2009

Errors in poll predictivness by pollster 2002-2009

In this case the data–closer to the bottom means less error and more predictiveness–lends itself to several relatively clear conclusions (the full data set is at the bottom):

  • Slovakia’s parliamentary elections produce small differences. During parliamentary elections–the first and third clusters–all firms tend to cluster closely together with a very small difference among them.  These surveys tend to be large enough and carefully-enough framed, and with voters sufficiently politicized that the polls tend to converge around a single answer.   The only exceptions here–Median and FOCUS–are not exceptions at all since these (like Median in 2009) are polls taken a month previously and (as the previous section shows) a month makes a some degree of difference (about 0.5 or so).
  • Europarliament elections produce bigger differences. During Europarliament elections the spreads are much greater and the number of pollsters much smaller.  Here the differences among pollsters would matter (if Slovaks felt that the elections themselves actually mattered, which most appear not to do).

With regard to specific pollsters, two stand out, but they have either ceased their work in this or work quite infrequently:

  • UVVM was an excellent pollster and the decision by the Slovak Statistical Office not to continue these tests is a big loss.
  • OMV does good polls.  It’s a pity they only do them immediately before elections.  (As an aside, no matter how good its polls may be, they cannot be used as a substitute for exit polls, as STV tried to do in 2006.  Even the best, biggest pre-election poll seems destined to miss something).

Of the pollsters who still regularly poll (and with the exception of MVK, post results with increasing regularity) we can say the following”

  • FOCUS has done a mediocre job in parliamentary elections but an excellent job in Euroelections.   Without UVVM it is at the most reliable remaining pollster
  • MVK, by these same calculations has done slightly worse than FOCUS but it too remains fairly solid.
  • Median has not done as well and has been the high-end outlier in the two most recent elections (in 2009 its poll was taken a month before the election but its errant 2006 poll was taken in the final rush).  This may be the result of Median’s open-ended preference question that does not as closely resemble the ballot process.
  • The big surprise, and perhaps it is simply a coincidence, is that the telephone poll conducted by Polis in 2006 actually came close to the mark.  Telephone polls have faced considerable criticism in the past, including my own, but this one worked.  The 2010 election will provide a major test of its reliability.

Finally on the question of pollsters, it may be that no pollster is better overall but that some may be better or worse in detecting support for particular parties.  As the Dashboard shows to even a casual observer (and as I will try to analyze in greater depth nearer to the election), some parties tend to do consistently better in some polls than in others.  Does this translate into differences in electoral predictiveness?  Again we face here a lack of data but what we have yields several conclusions about past patterns, though these are not particularly useful predictors for the future as they reflect a difference of at most a few points from the results of other pollsters.  Nevertheless, we can say that compared to other pollsters,

  • UVVM’s estimates for SDKU in all elections are less than those of other pollsters and its estimates for SNS and KDH are less than those of other posters in parliamentary elections.  UVVM also overestimated HZDS in almost elections.
  • OMV has underestimated Smer in parliamentary elections and underestimated SNS and KSS in parliamentary elections
  • FOCUS has consistently underestimated HZDS and KDH, and has slightly overestimated Smer in parliamentary elections (while slightly underestimating the party in Europarliament elections).  It has also slightly overestimated KSS in parliamentary elections
  • Median has overestimated Smer in both elections for which we have its data and has underestimated SMK and HZDS and KDH (all rural parties, suggesting a weaker rural network of poll takers)
  • MVK has overestimated Smer and KDH in parliamentary elections and underestimated SNS and KSS.
  • With only one poll in, we have no way of making a broader assessment for Polis,  but I for one will be very interested to see what happens next.
  • Postscript: Just discovered this article about accuracy of presidential election results.  It corresponds roughly to parliamentary election results with reasonable results for FOCUS, MVK and, surprisingly, Polis.  See http://volby.sme.sk/c/4360649/statna-agentura-odhadla-vysledky-katastrofalne-a-facebook.html

Party: Some parties outrun the polls (sometimes)

The most interesting question is whether polls as a whole tend to over-estimate or underestimate the electoral support of particular parties.  This is a rather easy circumstance to imagine:  the networks of pollsters do not extend to the ethnic or class group in which a particular party is strong, or a particularly segments of a party’s support base are overwhelmingly less (or more) likely to actually get out to the polls.  The graph below lays out the differences between the averages of the final polls (white circles) and parties’ actual election results (color coded circles) for four elections: the parliamentary election in 2002, Europarliament in 2004, parliament again in 2006 and Europarliament again in 2009.  The arrows (thick for parliamentary, thin for Europarliament) point from the poll prediction to the actual result.

Poll predictivness in Slovakia 2002-2009

Only for a few parties do these arrows show clear patterns over time:

  • SDKU has been underestimated by polls all four times, though the gap has narrowed considerably.
  • SMK has also been underestimated, though by smaller amounts (and the gap in 2009 is the result of the emergence of Most-Hid which did not run candidates)

For several other parties patterns are less distinct:

  • KDH and HZDS have been underestimated in Euroelections but results in parliamentary elections produce no clear result.
  • For SNS there is likewise no clear pattern in parliamentary elections but a pattern of overestimation in Euroelections.

The biggest question, of course, is Smer, a party whose poll predictivness becomes an intensely political question.  The results here suggest:

  • A pattern of consistent overestimation in the polls by significant numerical (and even percentagewise) amounts in Euroelections and the 2002 parliamentary election…
  • BUT (and this is a very important but) in the well-polled 2006 parliamentary elections the polls actually slightly underestimated Smer’s performance.

The Smer problem here is simply a large-scale representation of the problem that we find here in trying to make predictions against a moving target (the relationship between party poll support and voter turnout) and with very little data (N=2 for each kind of election).  (Still, for those who are interested, I include the full data at the end of this post.)

This question has driven experts to find a variety of proxy measures to figure out how to adjust polling numbers to reflect the final outcomes.  This post is already too long, however, so that will have to wait for another post (and lest this seem like an unfair cliff-hanger, know that the efforts so far have not produced a particularly compelling answer).

Data Tables for the Obsessive (by the obsessive)

Election Party Major parties Smer SDKU SNS SMK HZDS KDH KSS HDZ ANO PSNS SDA SDL SF All Parties
2002
Slovakia
Average +2.0 +3.8 -4.7 +0.8 -0.9 -0.8 -0.8 -2.1 +2.0 +0.8 -0.5 +0.3 +0.6 +1.5
OMV-SRo +1.8 +2.3 -5.6 +1.6 -0.4 +1.0 -0.5 -1.2 +1.9 +0.3 -0.5 +0.6 +0.6 +1.4
UVVM +1.8 +1.7 -6.6 +0.3 -1.1 -0.8 -1.1 -1.4 +2.1 -0.2 -0.7 -0.4 +1.4 +1.5
Markant +2.0 +4.3 -4.2 +0.7 -2.3 +0.5 +0.4 -1.8 +1.1 +1.0 -0.4 +0.2 +0.6 +1.5
Dicio +2.1 +4.2 -2.8 +0.4 -0.8 -2.2 -1.4 -3.0 +2.8 +1.4 -0.6 -0.2 +0.2 +1.7
MVK +2.3 +5.0 -4.7 +0.4 -0.8 -1.9 +0.1 -3.5 +1.2 +1.0 -0.3 +0.8 +0.2 +1.7
FOCUS +2.3 +5.2 -4.6 +1.4 -0.1 -1.4 -2.3 -1.5 +2.8 +1.2 -0.6 +0.7 +0.8 +1.9
2004
Europarliament
Average +4.3 +9.0 -8.5 +1.8 -1.7 -0.9 -7.0 +1.1 +2.4 +0.5 -0.4 +3.5
FOCUS +3.0 +0.7 -7.9 -1.1 +0.4 -1.4 -8.4 -1.3 +3.2 +1.6 -0.4 +2.6
OVM +4.5 +8.5 -7.3 +3.4 -2.9 -1.6 -5.6 +2.0 +2.1 +0.6 +0.4 +3.3
UVVM +5.0 +13.3 -9.2 +2.7 -2.1 +1.0 -6.9 -0.1 +2.6 +0.1 +0.2 +3.8
Dicio +5.7 +13.4 -9.6 +2.4 -1.9 -1.5 -7.1 +4.0 +1.8 -0.3 -1.8 +4.4
2006
Slovakia
Average +2.2 -1.6 -5.3 -1.7 -1.4 +2.7 +1.4 +1.2 +0.7 +0.8 +2.6 +2.0
OVM-Sro +2.0 -2.4 -4.8 +0.1 -1.7 +1.5 +1.3 +2.0 +0.9 +1.3 +0.8 +1.7
Polis +2.2 -2.5 -4.7 -1.1 -0.4 +2.5 +3.3 +0.6 +1.4 +0.8 +0.3 +1.8
UVVM +2.2 -0.6 -5.7 -2.0 -1.4 +4.1 +0.6 +1.2 +1.7 +0.9 +1.1 +1.9
MVK +2.3 -1.1 -5.9 -1.7 -1.7 +2.7 +2.2 +1.1 -0.6 -1.4 +2.5 +2.1
Dicio +2.4 -1.1 -5.7 -3.5 -2.0 +2.7 -0.2 +1.2 +0.4 +2.7 +5.0 +2.5
FOCUS +3.2 +2.6 -8.9 -3.6 -1.9 +2.3 +1.4 +1.6 +1.6 +2.0 +2.5 +2.8
Median +3.4 +0.7 -10.6 -3.6 -3.2 +1.8 +1.1 +2.7 +3.5 +1.1 +5.5 +3.4
2009
Europarliament
Average +3.9 +11.9 -2.6 +5.0 -3.5 -2.2 -1.6 -0.2 -0.4 +3.6
FOCUS +3.3 +8.4 -1.2 +3.4 -2.7 -3.7 -2.6 +1.1 +0.8 +3.0
UVVM +3.6 +11.7 -4.5 +5.0 -2.8 -0.5 -0.3 -0.0 -0.4 +3.1
MVK +3.9 +11.0 -1.6 +4.8 -3.0 -2.9 -2.7 +1.0 +0.9 +3.5
Median +5.0 +15.8 -2.0 +6.5 -4.8 -2.6 -1.9 -1.7 -1.6 +4.6

dd

Party Parliamentary Election Year Poll Avg. Result Raw Poll Error % Poll Error Average Poll Error Consistency
Smer Slovakia 2002 17.3 13.5 3.8 28% 12% Mixed
2006 27.6 29.1 -1.5 -5%
EU 2004 25.9 16.9 9.0 53% 46% Consistently too high
2009 44.3 32.0 12.3 38%
SDKU Slovakia 2002 10.4 15.1 -4.7 -31% -30% Consistently too low
2006 13.0 18.4 -5.4 -29%
EU 2004 8.6 17.1 -8.5 -50% -27% Consistently too low
2009 16.1 17.0 -0.9 -5%
SNS Slovakia 2002 4.1 3.3 0.8 23% 5% Mixed
2006 10.1 11.7 -1.6 -14%
EU 2004 3.9 2.0 1.9 94% 79% Consistently too high
2009 9.1 5.6 3.5 64%
MK Slovakia 2002 10.3 11.2 -0.9 -8% -10% Consistently too low
2006 10.3 11.7 -1.4 -12%
EU 2004 11.6 13.2 -1.6 -12% -26% Consistently too low
2009 6.9 11.3 -4.4 -39%
HZDS Slovakia 2002 18.7 19.5 -0.8 -4% 13% Mixed
2006 11.5 8.8 2.7 31%
EU 2004 16.1 17.0 -0.9 -6% -24% Consistently too low
2009 5.2 9.0 -3.8 -42%
KDH Slovakia 2002 7.5 8.3 -0.8 -9% 4% Mixed
2006 9.7 8.3 1.4 17%
EU 2004 9.2 16.2 -7.0 -43% -28% Consistently too low
2009 9.4 10.9 -1.5 -14%
KSS Slovakia 2002 4.2 6.3 -2.1 -33% -1% Mixed
2006 5.1 3.9 1.2 31%
EU 2004 5.7 4.5 1.2 26% 29% Consistently too high
2009 2.2 1.7 0.6 33%
SF Slovakia 2006 5.4 3.5 1.9 56% 56% No data
EU 2004 2.9 3.3 -0.4 -11% 11% Mixed
2009 2.1 1.6 0.5 33%
HZD Slovakia 2002 5.3 3.3 2.0 61% 113% Consistently too high
2006 1.7 0.6 1.1 166%
EU 2004 4.1 1.7 2.4 143% 143% No average
ANO Slovakia 2002 8.8 8.0 0.8 10% 53% Consistently too high
2006 2.8 1.4 1.4 97%
EU 2004 5.2 4.7 0.6 12% 12% No average

Polls, Politics and Parties, Part 3: How predictive are polls in Slovakia?

Bep4fore launching into an extended discussion of public opinion in Slovakia, I thought it would pay to look at the quality of the tools we actually have.  I approach this, however, as a non-specialist and look forward to input from others on how this compares to other countries and how better to measure what I am trying to get at.

I also undertake this knowing that whatever the results, I will still look at the topography of party support based on polls.  They are the proverbial lamppost under which we search for our lost keys–the keys may not be there but everywhere else is too dark.

Finally, I distinguish here between accuracy and predictiveness.  I have little doubt, knowing the experts who do this work in Slovakia, that the polls get a read on Slovak opinion that is close to what people actually think (sometimes better, sometimes worse but usually close).  That is not the same, however, as figuring out which of those people will actually come out to vote and how they will make up their minds in the voting booth itself.  When I talk below about “error,” I talk about the difference between what polls say and how ballots are actually cast rather than to mistakes by pollsters.  There may be a technical term for this that I don’t know and I’d be happy to learn it.

From the perspective of somebody who wants to know the result–or wants to make some money in the odds markets, the prediction value of polls for all elections in the sample (Slovakia’s parliament in 2002 and 2006, the European parliament in 2004 and 2009) is not particuarly encouraging.  The difference between results and the average of final polls was 2.5 percentage points which is 36% of the value of the actual result for the parties in question.  Even among major parties in higher turnout parliamentary elections of 2002 and 2006 the average poll got the average party result wrong by an absolute value of 2.1 percentage points or about 24% of the party’s actual result.  The maximum error recorded was 5.4 percentage points (31%). While some polls occasionally came close on specific parties, the poll average never did better than 0.8 percentage points (4%).

Nor do the levels of error seem to be decreasing.  In fact the levels and percentages of error are remarkably consistent from one election to the next when differentiated by the category of election.

Parliamentary Election Year Raw poll error % poll error
Slovak 2002 2.0 24%
2006 2.1 24%
Europarliament 2004 4.7 32%
2009 4.4 34%

This means that any guess about any party’s electoral results based on average public opinion polls, whether made in this blog or anywhere else is, at best likely to be 5% off in either direction and that the error will average (if the past is any guide, as it seems to be) around 24%.  For a party exactly at the 5% threshold, a 24% error produces a range between 4.0 and 6.25.  For a party with 30% support, that same average error produces a range between 28.0 and 43.75!  For low-turnout European parliament elections the potential range is even wider.  This resulting range is the combination of normal margins of survey error (a small part of the total) and a much larger component related to the likelihood of people to actually turn out to vote, regardless of their preferred parties.

The task, then, is to figure out whether there are any ways to figure out specific locations where the errors are likely to emerge and to try and correct for them.  This means looking specifically at time periods, parties, and polling firms, something I will do in the next post.

Politics, Polls and Parties, Part 2: Assessing the present and (badly) predicting the future

p1Yesterday I discussed my plan to undertake a relatively systematic analysis of Slovakia’s parties. I intend to get some additional insight by doing the analysis but preliminary look at the data suggest the following conclusions about where parties have been and where they are going. I hope that I will actually change some of these judgments in the process of analysis, so check back for the final conclusions–by late February.

In the meantime, here’s what I see in the current figures, enhanced by what I’ve learned elsewhere.

Category Party Current position Long term level Medium term Short term trend What will shape numbers in the next few months?

Dominant

Smer

40 ± 3

Gains from 2006 election

Decline from early 2009 peak

Flat

Aggressivity of campaign and national focus may help in some circles and hurt in others. At risk of scandals but good at damage control. Economic stabilization should help a bit.

Safe

SDKU

14 ± 3

Peaks and valleys but overall flat from 2009 election (party electoral performance usually better than polls)

Decline from peak in early 2009

Poll differences significant but seems like decline.

If Radicova is electoral leader and relatively untainted by scandal, may see some bounce at the expense of SaS (or may form electoral coalition).

KDH

10 ± 1

Flat until recently

Slight increase with coming of Figel

Slight decline from Figel peak but still higher than before

Most stable of all parties in Slovakia. Figel may have slight positive effect.

Near the line

SNS

7 ± 2

Peaked in 2008 and fell back below pre-2006 election levels

Erratic but with strong declining trend

Return to decline in recent polls

Election of Orban in Hungary will help but some voters may find Smer more palatable.

HZDS

6 ± 1

Steady decline since 2006 (actually since 1992)

Recovered in mid-2009 from sharp fall

Return to slight decline

Opaque. Voters aging but loyal. Some inverse relationship with Smer and SNS. Will be close to the threshold–likely just above but hard

to tell.

MKP-SMK

5 ± 3

Slow decline beginning after 2006 election (maybe slightly before)

Decline prior to and (especially sharp after) emergence of Most-Hid

Return to stability just above threshold

Depends heavily on personality
(advantage Most-Hid) and organization (advantage MKP-SMK). One should
get in. Maybe both.

Most-Hid

5 ± 3 (inverse to SMK)

New party

Not included in polls until 2009, beginning around 3% and growing rapidly

Stable just above threshold

SaS

6 ± 4 (inverse to SDKU)

New party

Emerged at 3-5% and grew moderately after

Mixed results make size of short term rise unclear: may be significant or slight

Depends on decisions within SDKU and (unclear) effectivness of novel organizational strategies (worked well in Europarliament elections but untested in higher turnout contests)

Hard to imagine

SF

1 ± 1

Erratic but overall gradual decline from 2006 election

Significant decline from peaks in winter 2008 and spring 2009.

Slight further decline

Hurt by rise of SaS and would be hurt more by elevation of Radicova in SDKU; not helped by merger with voter-less Liga and OK

KSS

2 ± 1

Erratic but overall gradual decline from 2006 election

Erratic peaks and valleys

Slight decline

Seems flat. Has not gained dissatisfied Smer voters.

SZ

1 ± 1

Erratic

Gradual decline from peaks in summer 2009

Slight decline

Seemed to have a chance and now seems not. Might benefit should Smer begin to crumble but not in near term.

HZD

1 ± 1

Flat

Decline from 2% levels in late 2008-early 2009

Flat or slight decline

Merging with Smer, soon to disappear.

Parties, Polls and Politics in Slovakia: Part 1 of a multi-part series.

p0Lots of news from Slovakia in the past two weeks, some obvious and some not. In addition to changes in Slovakia’s leading opposition party SDKU-DS, the reports of recent days have also included a series of other minor revelations and lots and lots of polling data including some new sources.  I’ll try to address some of the quick and ephemeral issues in the next blog entry and then on to something more systematic.

It is my hope over the next several weeks to look at Slovakia’s party system in some detail as summary of the year past and preparation for the busy electoral season ahead (though the campaign’s been in full swing since Christmas). In particular I want to look at long term polling data for each of the major parties, looking at trends in support, the relationship of poll numbers to internal party politics and the relationship of polls to election results.  I’ll be posting those as “Parties, Polls and Politics” and tagging them as “ppp” and they’ll serve as the basis of better analysis come election time.