Czech Dashboard News: New parties and the big picture

I will deal with the actual poll results in a few future posts, but I want build on the introduction of the Czech dashboard by talking about broader trends and in particular by assessing the magnitude of “new party eruptions,” the dominant feature of the current Czech campaign.

In my own recent study of populism and new parties, the Czech Republic has become interesting to me for two reasons: first because it is a “dog that didn’t bark”–its “new party cycle” remained confined to a small segment of the political spectrum for over a decade; and second because (as in Hungary, which just saw its highest degree of new party vote since the fall of communism) the Czech “dog” has begun to scratch at the door and looks set to start yapping.

It is useful to start with a graph of the overall picture of party preferences in Czech Republic in the last eight years (a graph presented in dynamic and updated form on the dashboard)

Key: █ ODS █ CSSD █ SZ █ KDU-CSL █ KSCM █ VV █ TOP09 █ SPO █ US █ DS █ Suverenita

Several features stand out. First is the relative stability of the three largest parties. The two larger parties, the orange CSSD and the dark blue ODS swapped positions twice during this period but (with the exception of two dark years for CSSD under Spidla and Gross in the early 2002, remained in competition for the top spot well ahead of the others. The red line which denotes the Communist Party stays remarkably stable between 12% and 20%, almost unchanged from month to month for the last four years. Below them the lighter blue KDU-CSL remained in stable fourth place (usually) but showed a slightly declining trend. Together, these four parties have formed the core of the Czech party system from 1992 until the present. Thus far stability.

The second interesting feature is nearer the bottom of the graph, where parties are born and die. The Czech Republic has regularly seen activity in this zone but it has usually been of a particular type, usually a fifth party with market liberal and cultural libertarian positions.  These parties kept the zone filled because they usually exhibited a limited lifespan: ODA lasted from 1992 until 1998, US from 1998 until 2006, SZ from 2006 until (and perhaps beyond) the present. (In the mid-1990’s the Czech system also included a sixth party, the anti-Roma Republicans, but their demise did not lead to a substantial replacement except for the vocal but small DS and NS). The center-right parties account for a considerable degree of the variability of the system shown above, and the combination of stability among the main four parties and the failure of other new parties to emerge kept the “extra-system” volatility low.

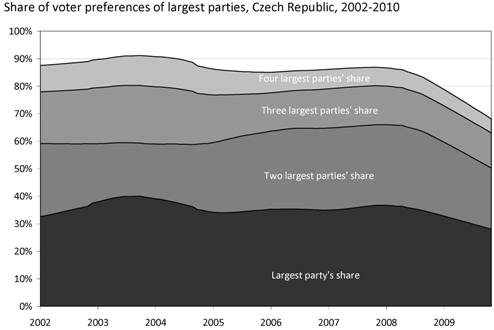
This seems to be changing.  The graph below shows the a smoothed line for the combined share of preferences for the top 1,2,3 and 4 parties. Between the early 2000’s and mid-2009 this remained stable, within around 5 points of 90%. But in the last year something new has emerged.

The stability of the Czech system now faces significant changes, and there are good arguments to be made that these are fundamental changes rather than merely cosmetic ones.

First, as the graph shows, the position of the top four parties have dropped considerably to the point that the share obtained by the top party is now smaller than the share obtained by parties outside the top four. Despite similarly high past levels of dissatisfaction with the major parties, this same trend did not emerge before the 2002 or 2006 elections.

Second, the opinion shifts are poised to have a significant shift on the actual composition of the Czech party system. In the past four elections the Czech system has worked like clockwork: the four stable parties gained seats in parliament and the fifth faced a birth-death cycle every two elections (ODA elected in 1992 and 1996, dead in 1998; US elected in 1998 and 2002, dead in 2006) but the cycle has intensified and spread. According to the most recent poll results (available in the Dashboard) SZ does not look likely to follow ODA and US by retaining seats in parliament. Furthermore, there is a not insignificant chance (though also no guarantee) that 2010 will exclude two parliamentary parties–not only SZ but also KDU-CSL is at significant risk–and the birth of two others–both TOP09 and Veci Verejne (VV).

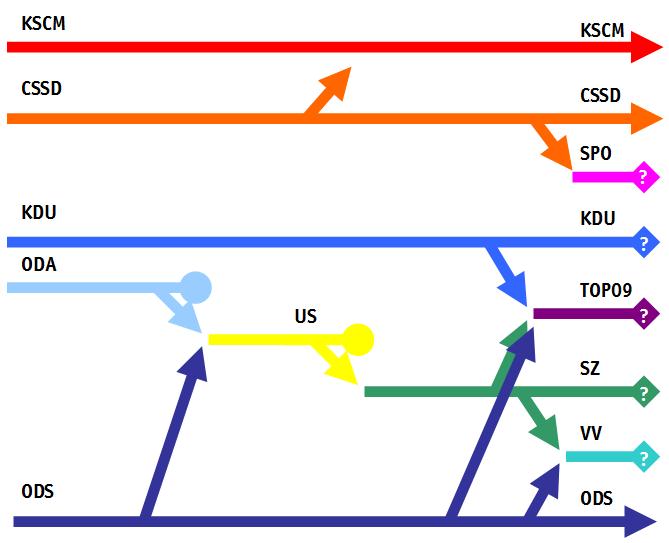
The third shift, a bit smaller, is paradoxically signified by the stability of the Communist Party. In past election campaigns, voters on the left have signaled dissatisfaction with the Social Democrats by opting for the Communists. This year, despite significant dissatisfaction and declining CSSD preferences, the Communists have seen no gains at all. Instead, voters from CSSD have left for Zeman’s SPO and probably (though I don’t have the data) for VV. It is unlikely that SPO will be elected to parliament (its rise has stalled according to the most recent polls), but its ability to attract a a measurable share of the vote suggests that the Communists are no longer the only (or indeed the main) reservoir for the newly dissatisfied (or that if they are, SPO is attracting some of those dissatisfied in turn with KSCM).

The graph below offers a very loose, schematic hypothesis about the ebb and flow of voters within the Czech system. It suggests that the current situation is characterized by the potential for new alternatives on the left and by the emergence of alternatives on the right that draw not only from ODS–there has always been a significant share of voters that agreed with ODS’s positions but did not like the party itself–but also from KDU-CSL.

This would be a significant change even if TOP09 were simply a replacement for KDU-CSL and VV simply replaced the Czech Greens, but we are not talking one-for-one replacement here. KDU-CSL has had a substantial membership base and a strong internal organization and a fairly broad intra-party elite; SZ has seen significant internal change but with fairly significant internal competition. By contrast both TOP09 and VV seem to be largely top-down creations without strong membership bases or independent elites outside the top figures. In our research on Slovakia, Marek Rybar and I have found a strong correlation between the date of party establishment one one hand and the degree of party organization and intra-party democracy on the other. Lack of organization in turn weakens the ability of parties to survive the ordinary ups and downs of party fortunes; centralization makes it difficult for parties to cope with the weaknesses of individual leaders (ODS and CSSD have shown a strong ability to recover from crises by changing leaders; in leader-driven projects, voters and intra-party rivals are more likely to turn elsewhere, usually to other new parties. If Slovakia (or almost any other country in the region) is any guide, new parties are shorter lived. Replacement of KDU-CSL by TOP09, therefore, strongly implies the subsequent replacement of TOP09 by some other party. The Czech Republic could therefore come to resemble its neighbors in the region with a churn of new parties that extends beyond the narrow realm of volatility in the Czech center-right.  As Czech dogs say, “haf haf.”

Self-Promotion Theatre Presents: My interview on polls with the Slovak Spectator

Thanks to Michaela Stankova of the Slovak Spectator for asking good questions about changes in public opinion in Slovakia.  Her questions, in fact, serve as prompts for some of my future blog posts, but in the meantime you can read the interview here:

http://spectator.sme.sk/articles/view/38874/2/polls_consistently_show_coalition_slumping.html

Euroblindness, Part IV: Slovenska slepota

To even a first time reader of this blog, it is clear that I am addicted to the politics of Central Europe, but some long-time readers might also know that I also have a minor (but still unhealthy fascination) with the Eurovision song contest– coming up in less than two weeks, by the way.  These two things came together for me in a new way when I read SME‘s nice nice piece on Slovakia’s campaign songs from seasons past (http://volby.sme.sk/c/5376090/najlepsie-predvolebne-piesne-od-hzds-po-obamu.html), a follow up to their piece last week on the new HZDS theme song for 2010 (http://volby.sme.sk/c/5368283/hzds-nakrutilo-vivat-slovakia-ii.html).

Watching Vivat Slovakia again (alternative version here) and listening to the other political songs included by SME, I am struck at the degree to which Slovakia’s political songs bear resemblance to some of its Eurovision songcontest, which should not be taken as a complement to either.  This raises interesting possibilities for new mashups and co-op marketing opportunities:  Eurovision already has strong political element and a much-debated electoral system so why not complete the circuit by formalizing the role of entertainment in politics.  Ladies and gentlemen, I present:

Next round to be held in 2014, finals in Strasbourg.

Finally, I cannot let a discussion of political songs go by without what is, in my mind at least, Slovakia’s best political song:

Polls, Politics and Parties, Part 4: Poll Predictiveness by Party, Pollster and Time

p16How well do public opinion polls in Slovakia predict election outcomes?  Well as the previous post suggests, not too well.  But they’re all we’ve got.  Of course we could always wait until the future comes to us, but, frankly, where’s the fun in that.  So rather than sit around and wait or make faulty predictions, we can try to figure out where and when the data we do have is most useful.  We can get a bit more mileage out of the data if we understand its strengths and limitations on three dimensions: time period, pollster and party   (It is theoretically possible to go further and divide it by categories within the surveyed population, but that requires the original data which is available only for limited periods and certain pollsters and so I will hold off on that for the moment.)  It is no surprise that recent data is better than old data, but even that generalization has its limits.  And while we can’t assume that polls will err in the future in the same way as in the past, it is important to know where the diversion between poll and reality crept in.

Time: Polls get better closer to elections.  Sort of.

As we elections near, shouldn’t polls become more predictive?  Yes, but not in a purely linear fashion.  I do not have a lot of data on this–only 3 elections, two of which were for the European parliament–but what I do have suggests that increases in predictiveness really only begins about 6 months before the election.  The graph below shows the differences in raw percentage points between poll “predictions” and actual results extending backward from election day.

Predictiveness of average poll results or major parties, approaching election

Predictiveness of average poll results or major parties, approaching election

There is quite a bit in these finding are news to me:

  • Improvement is not linear. I did not expect the “reversal” that occurs between one and two years out in each case–such that in each elections predictions made about 500 days before the election would be better than those made 200 days before the election.  Of course it is impossible to predict on what day to make the best predictions (for Slovakia’s parliament in 2006, T-500 days was better than T-700 or T-200, but this was not true for the 2009 Euroelections.
  • Europarliament predictions do not get better over time; Slovak parliament predictions do. Nor did I expect, though I should have, that predictions in Europarliament elections actually don’t get any better over time.  This is clearly related, I think, to the low voter turnout in Euroelections.  In this case the polls are considerably more representative than the elections themselves.  The results for Slovakia’s parliament, by contrast, have plateaus and valleys but do get closer to actual results with time.  (And one small footnote:  I worried that the results above were the result of differences in polling patterns: Slovak parliamentary elections have more polls and might therefore be more accurate.  But when I re-ran the numbers with only a single polling firm–UVVM–I got essentially the same results, suggesting that the patterns do not depend on the polling density).
  • Sharp increases in predictiveness come in the last 150 days. For two of the three polls, the best increase in accuracy came in the final five months and since today we are at entering month 4, we are already in that period.  Using these models (a rather thin basis for comparison) we could guess that we are just leaving the period of relatively low predictability and so any judgments made on the basis of polls to date should be taken with some care.  By a month out, we can make guesses about the final result that are not overwhelmingly different from the final rush of polls.  That’s not true today.

Pollster: Some firms are better than others, but not by too much

The second big question of accuracy depends on the pollster.  It may be that some firms are simply better than others and that to average them together is to inject unnecessary noise.  The graph below shows the errors in poll predictivness for each major polling firm’s final pre-election survey in four elections:  Slovakia’s parliament in 2002, Europarliament in 2004, Slovakia’s parliament in 2006 and Europarliament again in 2009.  Gray boxes mark “final” polls taken more than a month before the election.

Poll predictivness by pollster 2002-2009

Errors in poll predictivness by pollster 2002-2009

In this case the data–closer to the bottom means less error and more predictiveness–lends itself to several relatively clear conclusions (the full data set is at the bottom):

  • Slovakia’s parliamentary elections produce small differences. During parliamentary elections–the first and third clusters–all firms tend to cluster closely together with a very small difference among them.  These surveys tend to be large enough and carefully-enough framed, and with voters sufficiently politicized that the polls tend to converge around a single answer.   The only exceptions here–Median and FOCUS–are not exceptions at all since these (like Median in 2009) are polls taken a month previously and (as the previous section shows) a month makes a some degree of difference (about 0.5 or so).
  • Europarliament elections produce bigger differences. During Europarliament elections the spreads are much greater and the number of pollsters much smaller.  Here the differences among pollsters would matter (if Slovaks felt that the elections themselves actually mattered, which most appear not to do).

With regard to specific pollsters, two stand out, but they have either ceased their work in this or work quite infrequently:

  • UVVM was an excellent pollster and the decision by the Slovak Statistical Office not to continue these tests is a big loss.
  • OMV does good polls.  It’s a pity they only do them immediately before elections.  (As an aside, no matter how good its polls may be, they cannot be used as a substitute for exit polls, as STV tried to do in 2006.  Even the best, biggest pre-election poll seems destined to miss something).

Of the pollsters who still regularly poll (and with the exception of MVK, post results with increasing regularity) we can say the following”

  • FOCUS has done a mediocre job in parliamentary elections but an excellent job in Euroelections.   Without UVVM it is at the most reliable remaining pollster
  • MVK, by these same calculations has done slightly worse than FOCUS but it too remains fairly solid.
  • Median has not done as well and has been the high-end outlier in the two most recent elections (in 2009 its poll was taken a month before the election but its errant 2006 poll was taken in the final rush).  This may be the result of Median’s open-ended preference question that does not as closely resemble the ballot process.
  • The big surprise, and perhaps it is simply a coincidence, is that the telephone poll conducted by Polis in 2006 actually came close to the mark.  Telephone polls have faced considerable criticism in the past, including my own, but this one worked.  The 2010 election will provide a major test of its reliability.

Finally on the question of pollsters, it may be that no pollster is better overall but that some may be better or worse in detecting support for particular parties.  As the Dashboard shows to even a casual observer (and as I will try to analyze in greater depth nearer to the election), some parties tend to do consistently better in some polls than in others.  Does this translate into differences in electoral predictiveness?  Again we face here a lack of data but what we have yields several conclusions about past patterns, though these are not particularly useful predictors for the future as they reflect a difference of at most a few points from the results of other pollsters.  Nevertheless, we can say that compared to other pollsters,

  • UVVM’s estimates for SDKU in all elections are less than those of other pollsters and its estimates for SNS and KDH are less than those of other posters in parliamentary elections.  UVVM also overestimated HZDS in almost elections.
  • OMV has underestimated Smer in parliamentary elections and underestimated SNS and KSS in parliamentary elections
  • FOCUS has consistently underestimated HZDS and KDH, and has slightly overestimated Smer in parliamentary elections (while slightly underestimating the party in Europarliament elections).  It has also slightly overestimated KSS in parliamentary elections
  • Median has overestimated Smer in both elections for which we have its data and has underestimated SMK and HZDS and KDH (all rural parties, suggesting a weaker rural network of poll takers)
  • MVK has overestimated Smer and KDH in parliamentary elections and underestimated SNS and KSS.
  • With only one poll in, we have no way of making a broader assessment for Polis,  but I for one will be very interested to see what happens next.
  • Postscript: Just discovered this article about accuracy of presidential election results.  It corresponds roughly to parliamentary election results with reasonable results for FOCUS, MVK and, surprisingly, Polis.  See http://volby.sme.sk/c/4360649/statna-agentura-odhadla-vysledky-katastrofalne-a-facebook.html

Party: Some parties outrun the polls (sometimes)

The most interesting question is whether polls as a whole tend to over-estimate or underestimate the electoral support of particular parties.  This is a rather easy circumstance to imagine:  the networks of pollsters do not extend to the ethnic or class group in which a particular party is strong, or a particularly segments of a party’s support base are overwhelmingly less (or more) likely to actually get out to the polls.  The graph below lays out the differences between the averages of the final polls (white circles) and parties’ actual election results (color coded circles) for four elections: the parliamentary election in 2002, Europarliament in 2004, parliament again in 2006 and Europarliament again in 2009.  The arrows (thick for parliamentary, thin for Europarliament) point from the poll prediction to the actual result.

Poll predictivness in Slovakia 2002-2009

Only for a few parties do these arrows show clear patterns over time:

  • SDKU has been underestimated by polls all four times, though the gap has narrowed considerably.
  • SMK has also been underestimated, though by smaller amounts (and the gap in 2009 is the result of the emergence of Most-Hid which did not run candidates)

For several other parties patterns are less distinct:

  • KDH and HZDS have been underestimated in Euroelections but results in parliamentary elections produce no clear result.
  • For SNS there is likewise no clear pattern in parliamentary elections but a pattern of overestimation in Euroelections.

The biggest question, of course, is Smer, a party whose poll predictivness becomes an intensely political question.  The results here suggest:

  • A pattern of consistent overestimation in the polls by significant numerical (and even percentagewise) amounts in Euroelections and the 2002 parliamentary election…
  • BUT (and this is a very important but) in the well-polled 2006 parliamentary elections the polls actually slightly underestimated Smer’s performance.

The Smer problem here is simply a large-scale representation of the problem that we find here in trying to make predictions against a moving target (the relationship between party poll support and voter turnout) and with very little data (N=2 for each kind of election).  (Still, for those who are interested, I include the full data at the end of this post.)

This question has driven experts to find a variety of proxy measures to figure out how to adjust polling numbers to reflect the final outcomes.  This post is already too long, however, so that will have to wait for another post (and lest this seem like an unfair cliff-hanger, know that the efforts so far have not produced a particularly compelling answer).

Data Tables for the Obsessive (by the obsessive)

Election Party Major parties Smer SDKU SNS SMK HZDS KDH KSS HDZ ANO PSNS SDA SDL SF All Parties
2002
Slovakia
Average +2.0 +3.8 -4.7 +0.8 -0.9 -0.8 -0.8 -2.1 +2.0 +0.8 -0.5 +0.3 +0.6 +1.5
OMV-SRo +1.8 +2.3 -5.6 +1.6 -0.4 +1.0 -0.5 -1.2 +1.9 +0.3 -0.5 +0.6 +0.6 +1.4
UVVM +1.8 +1.7 -6.6 +0.3 -1.1 -0.8 -1.1 -1.4 +2.1 -0.2 -0.7 -0.4 +1.4 +1.5
Markant +2.0 +4.3 -4.2 +0.7 -2.3 +0.5 +0.4 -1.8 +1.1 +1.0 -0.4 +0.2 +0.6 +1.5
Dicio +2.1 +4.2 -2.8 +0.4 -0.8 -2.2 -1.4 -3.0 +2.8 +1.4 -0.6 -0.2 +0.2 +1.7
MVK +2.3 +5.0 -4.7 +0.4 -0.8 -1.9 +0.1 -3.5 +1.2 +1.0 -0.3 +0.8 +0.2 +1.7
FOCUS +2.3 +5.2 -4.6 +1.4 -0.1 -1.4 -2.3 -1.5 +2.8 +1.2 -0.6 +0.7 +0.8 +1.9
2004
Europarliament
Average +4.3 +9.0 -8.5 +1.8 -1.7 -0.9 -7.0 +1.1 +2.4 +0.5 -0.4 +3.5
FOCUS +3.0 +0.7 -7.9 -1.1 +0.4 -1.4 -8.4 -1.3 +3.2 +1.6 -0.4 +2.6
OVM +4.5 +8.5 -7.3 +3.4 -2.9 -1.6 -5.6 +2.0 +2.1 +0.6 +0.4 +3.3
UVVM +5.0 +13.3 -9.2 +2.7 -2.1 +1.0 -6.9 -0.1 +2.6 +0.1 +0.2 +3.8
Dicio +5.7 +13.4 -9.6 +2.4 -1.9 -1.5 -7.1 +4.0 +1.8 -0.3 -1.8 +4.4
2006
Slovakia
Average +2.2 -1.6 -5.3 -1.7 -1.4 +2.7 +1.4 +1.2 +0.7 +0.8 +2.6 +2.0
OVM-Sro +2.0 -2.4 -4.8 +0.1 -1.7 +1.5 +1.3 +2.0 +0.9 +1.3 +0.8 +1.7
Polis +2.2 -2.5 -4.7 -1.1 -0.4 +2.5 +3.3 +0.6 +1.4 +0.8 +0.3 +1.8
UVVM +2.2 -0.6 -5.7 -2.0 -1.4 +4.1 +0.6 +1.2 +1.7 +0.9 +1.1 +1.9
MVK +2.3 -1.1 -5.9 -1.7 -1.7 +2.7 +2.2 +1.1 -0.6 -1.4 +2.5 +2.1
Dicio +2.4 -1.1 -5.7 -3.5 -2.0 +2.7 -0.2 +1.2 +0.4 +2.7 +5.0 +2.5
FOCUS +3.2 +2.6 -8.9 -3.6 -1.9 +2.3 +1.4 +1.6 +1.6 +2.0 +2.5 +2.8
Median +3.4 +0.7 -10.6 -3.6 -3.2 +1.8 +1.1 +2.7 +3.5 +1.1 +5.5 +3.4
2009
Europarliament
Average +3.9 +11.9 -2.6 +5.0 -3.5 -2.2 -1.6 -0.2 -0.4 +3.6
FOCUS +3.3 +8.4 -1.2 +3.4 -2.7 -3.7 -2.6 +1.1 +0.8 +3.0
UVVM +3.6 +11.7 -4.5 +5.0 -2.8 -0.5 -0.3 -0.0 -0.4 +3.1
MVK +3.9 +11.0 -1.6 +4.8 -3.0 -2.9 -2.7 +1.0 +0.9 +3.5
Median +5.0 +15.8 -2.0 +6.5 -4.8 -2.6 -1.9 -1.7 -1.6 +4.6

dd

Party Parliamentary Election Year Poll Avg. Result Raw Poll Error % Poll Error Average Poll Error Consistency
Smer Slovakia 2002 17.3 13.5 3.8 28% 12% Mixed
2006 27.6 29.1 -1.5 -5%
EU 2004 25.9 16.9 9.0 53% 46% Consistently too high
2009 44.3 32.0 12.3 38%
SDKU Slovakia 2002 10.4 15.1 -4.7 -31% -30% Consistently too low
2006 13.0 18.4 -5.4 -29%
EU 2004 8.6 17.1 -8.5 -50% -27% Consistently too low
2009 16.1 17.0 -0.9 -5%
SNS Slovakia 2002 4.1 3.3 0.8 23% 5% Mixed
2006 10.1 11.7 -1.6 -14%
EU 2004 3.9 2.0 1.9 94% 79% Consistently too high
2009 9.1 5.6 3.5 64%
MK Slovakia 2002 10.3 11.2 -0.9 -8% -10% Consistently too low
2006 10.3 11.7 -1.4 -12%
EU 2004 11.6 13.2 -1.6 -12% -26% Consistently too low
2009 6.9 11.3 -4.4 -39%
HZDS Slovakia 2002 18.7 19.5 -0.8 -4% 13% Mixed
2006 11.5 8.8 2.7 31%
EU 2004 16.1 17.0 -0.9 -6% -24% Consistently too low
2009 5.2 9.0 -3.8 -42%
KDH Slovakia 2002 7.5 8.3 -0.8 -9% 4% Mixed
2006 9.7 8.3 1.4 17%
EU 2004 9.2 16.2 -7.0 -43% -28% Consistently too low
2009 9.4 10.9 -1.5 -14%
KSS Slovakia 2002 4.2 6.3 -2.1 -33% -1% Mixed
2006 5.1 3.9 1.2 31%
EU 2004 5.7 4.5 1.2 26% 29% Consistently too high
2009 2.2 1.7 0.6 33%
SF Slovakia 2006 5.4 3.5 1.9 56% 56% No data
EU 2004 2.9 3.3 -0.4 -11% 11% Mixed
2009 2.1 1.6 0.5 33%
HZD Slovakia 2002 5.3 3.3 2.0 61% 113% Consistently too high
2006 1.7 0.6 1.1 166%
EU 2004 4.1 1.7 2.4 143% 143% No average
ANO Slovakia 2002 8.8 8.0 0.8 10% 53% Consistently too high
2006 2.8 1.4 1.4 97%
EU 2004 5.2 4.7 0.6 12% 12% No average

Polls, Politics and Parties, Part 3: How predictive are polls in Slovakia?

Bep4fore launching into an extended discussion of public opinion in Slovakia, I thought it would pay to look at the quality of the tools we actually have.  I approach this, however, as a non-specialist and look forward to input from others on how this compares to other countries and how better to measure what I am trying to get at.

I also undertake this knowing that whatever the results, I will still look at the topography of party support based on polls.  They are the proverbial lamppost under which we search for our lost keys–the keys may not be there but everywhere else is too dark.

Finally, I distinguish here between accuracy and predictiveness.  I have little doubt, knowing the experts who do this work in Slovakia, that the polls get a read on Slovak opinion that is close to what people actually think (sometimes better, sometimes worse but usually close).  That is not the same, however, as figuring out which of those people will actually come out to vote and how they will make up their minds in the voting booth itself.  When I talk below about “error,” I talk about the difference between what polls say and how ballots are actually cast rather than to mistakes by pollsters.  There may be a technical term for this that I don’t know and I’d be happy to learn it.

From the perspective of somebody who wants to know the result–or wants to make some money in the odds markets, the prediction value of polls for all elections in the sample (Slovakia’s parliament in 2002 and 2006, the European parliament in 2004 and 2009) is not particuarly encouraging.  The difference between results and the average of final polls was 2.5 percentage points which is 36% of the value of the actual result for the parties in question.  Even among major parties in higher turnout parliamentary elections of 2002 and 2006 the average poll got the average party result wrong by an absolute value of 2.1 percentage points or about 24% of the party’s actual result.  The maximum error recorded was 5.4 percentage points (31%). While some polls occasionally came close on specific parties, the poll average never did better than 0.8 percentage points (4%).

Nor do the levels of error seem to be decreasing.  In fact the levels and percentages of error are remarkably consistent from one election to the next when differentiated by the category of election.

Parliamentary Election Year Raw poll error % poll error
Slovak 2002 2.0 24%
2006 2.1 24%
Europarliament 2004 4.7 32%
2009 4.4 34%

This means that any guess about any party’s electoral results based on average public opinion polls, whether made in this blog or anywhere else is, at best likely to be 5% off in either direction and that the error will average (if the past is any guide, as it seems to be) around 24%.  For a party exactly at the 5% threshold, a 24% error produces a range between 4.0 and 6.25.  For a party with 30% support, that same average error produces a range between 28.0 and 43.75!  For low-turnout European parliament elections the potential range is even wider.  This resulting range is the combination of normal margins of survey error (a small part of the total) and a much larger component related to the likelihood of people to actually turn out to vote, regardless of their preferred parties.

The task, then, is to figure out whether there are any ways to figure out specific locations where the errors are likely to emerge and to try and correct for them.  This means looking specifically at time periods, parties, and polling firms, something I will do in the next post.

European Parliament Elections: The Wonder of Wikipedia

Wikipedia hosts not only basic factual information regarding the recent elections but excellent analysis as well, particularly regarding the relative efficacy this time of preference voting with  3 out of 13 getting positions thanks to preference voting: Zaborska (KDH), Mikolasik (KDH) and Paska (SNS–though helped perhaps by his famous Smer namesake?).   Full information is here.

http://en.wikipedia.org/wiki/European_Parliament_election,_2009_(Slovakia)

Thanks to a reader for pointing it out and…I suspect…for providing the said analysis.

European Parliament Elections, Slovakia 2009

A few initial thoughts (perhaps my only thoughts) on Slovakia’s Europarliament Elections.
In general there are few surprises here:  Smer wins, SDKU follows at at a great distance, along with SMK and KDH.  Perhaps the only superficial surprise is the apparent reversal of numbers for SNS and HZDS, but even this is not particularly surprising in light of other characteristics of these parties.  As usual, it helps to look at the results against the background of polls and the previous Euroelection.  Full election results with comparisons to 2004 and to various polls are here and in a table at the end.

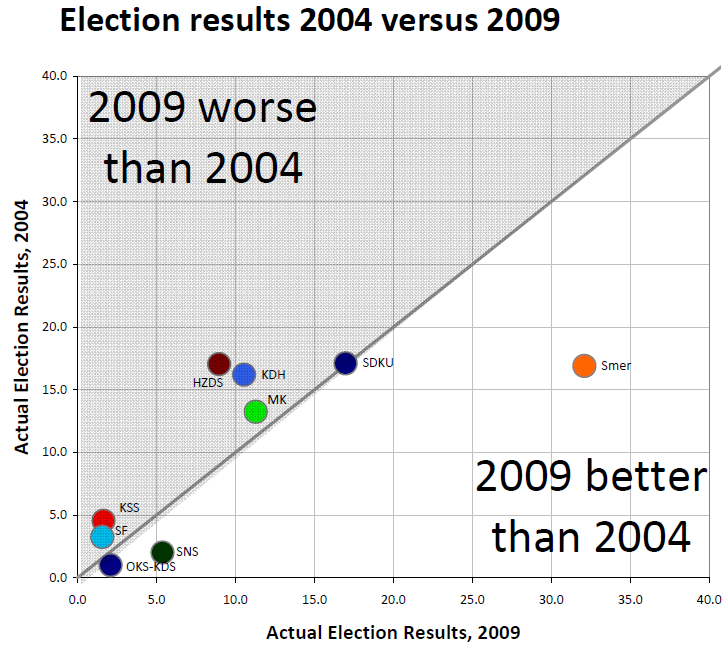
First, how does this look in comparison to the last (i.e. first) Euroelections in Slovakia, held in 2004.  Turnout appears to be slightly up, but slightly up from the lowest in Europe is still just the lowest in Europe.  In terms of party results, I’ve created a series of charts that array the parties on the Y (vertical) axis in terms of past performance, according to a variety of markers and the X (horizontal) axis in terms of present performance in elections.  Do that for the 2004 and 2009 results and here’s what you get:

pozorblog-euroelection-result-2004-v-result-2009.png

As is obvious, Smer does far better than before (over 30% compared with its disappointing under 20% in 2004), picking up 5 seats instead of its previous 3 and far outpacing the rest.  SDKU is next with results almost identical to those of 2004. Following a bit behind in a tight cluster are MK, KDH and HZDS, all performing worse than in 2004, by various margins and for various reasons (but more on that later) and then just above the 5% threshold, SNS.  All parties currently with seats in Slovakia’s parliament get Europarliament seats and no non-parliamentary parties make it across the threshold).

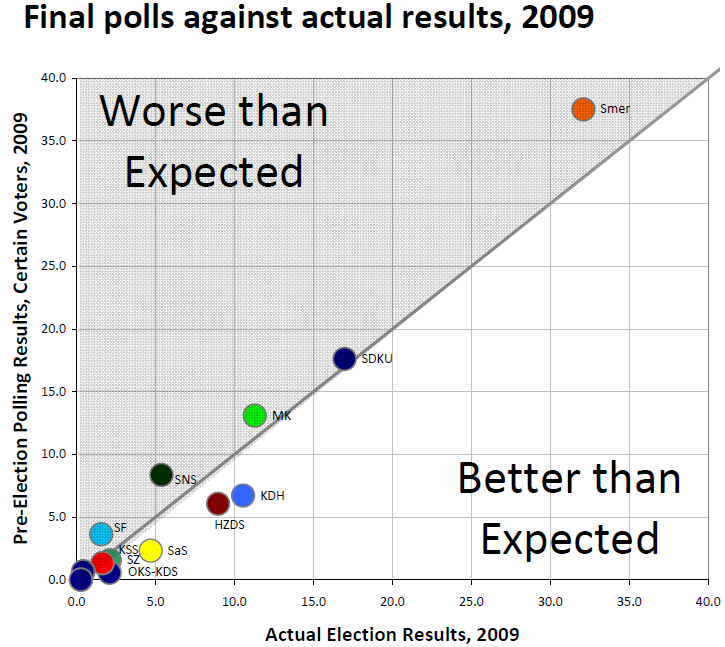
Clearly, by this standard 0f 2004 we have a major victory for Smer.  But there are other metrics.  A second way to look at this is to compare it to the most recent poll, does it beat expectations?  By that standard, this is what we get:

pozorblog-euroelection-final-polls-v-result-2004.png

Smer and SNS do worse than expected, SNS by a slightly smaller raw percentage but a much higher relative share.  SMK does slightly worse than expected while KDH, HZDS and SAS do better.  What explains these differences?  Two of the three parties that did worse than expected also have the reputation (backed up by some research I’ve done) for weaker than average organizations.  In a low turnout election, organization makes a difference.  KDH and HZDS both have better than average organizations and and relatively stable, older than average electorates who dutifully turn out to vote.  SMK is also fairly well organized, but the party is currently in the midst of major turmoil (more here and more from me later).  The interesting addition to this list is SaS–Sulik’s Freedom and Solidarity.  New parties in Slovakia have rarely developed organizations that could push turnout in this kind of election, but Sulik appears to have made effective use of online social networks and other similar structures to mobilize young, educated voters who might otherwise stay home.  The bad news for SaS is that they just barely missed the chance to shake things up by getting a seat that would gain them some visibility and the same techniques will not have the same impact in higher turnout parliamentary elections in 2010.  Still, SaS will comes out of this strengthened vis-a-vis other small social-liberal parties (SF and Liga with quite bad performances, and the Greens not moving beyond their very small base) and has an opportunity to pick up the “disaffected SDKU” vote.  OKS-KDS did better than the previous year: Palko’s presence helped, no doubt, as the only party leader on the ballot of any party, but the party’s inability to push much beyond 2% in this election does not bode well for 2010.  KSS continues to hover around 1.5%, as it does in the polls, without much immediate hope of revival.

Finally, we can look at these results against the general recent performance of parties at the national level, averaging scores from FOCUS polls (now the only major one left that reports results fully and regularly) since the beginning of the year:

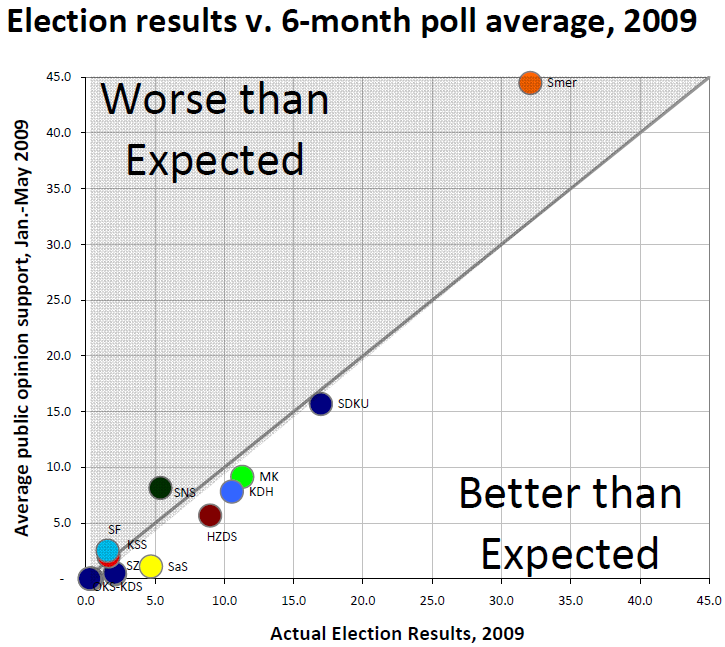
pozorblog-euroelection-poll-avg-v-result-2009.png

The results here are not wildly different from the previous graph, but it does suggest some cause for concern by Smer.  A 32% result in the Euroelections is great if it is double that of your next largest competitor, but slightly worrisome if it is 14% lower than the party’s average for the year to date.  Of course this is a low turnout election (this happened to Smer before in 2004, and even worse) but 2010 may not be particularly high either.  As with the presidential election, the results suggest that even with rather poor political play, the right wing manages to do better in elections than in the opinion polls (which show SDKU, SMK and KDH hovering around 30%-35%.  For now Smer is so far ahead that this makes little difference, but the party cannot afford to be complacent, especially, unlike its predecessor HZDS which once found itself in a similar position, Smer does not have such a strong organizational base to fall back upon.

The actual numbers are available online at Google Docs:

http://http://spreadsheets.google.com/pub?key=pdhlCClsiyAMi39bLFpY_Zg&single=true&gid=3&output=html

And the most recent three months are below in tabular format (using “iframe” which may not work on all browsers).

<br />

——–

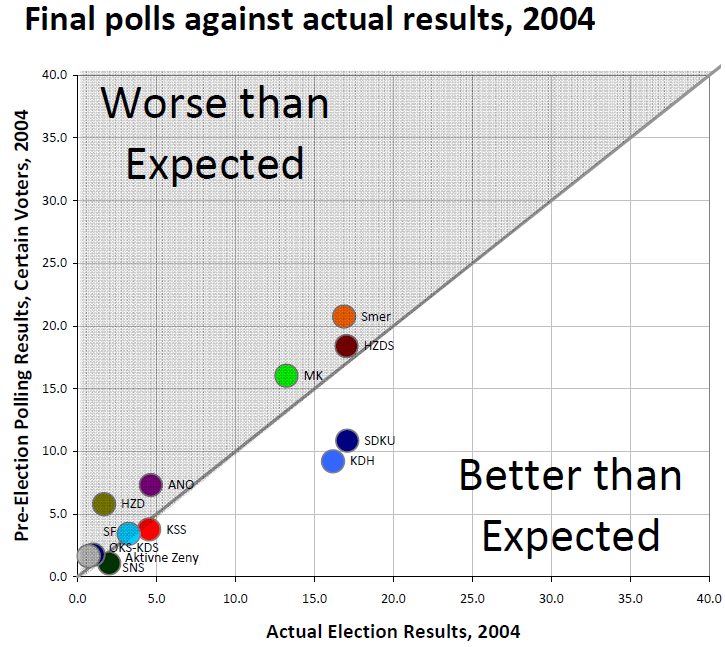
The main points are above, but in the process of making them, I made a few others that I don’t want to waste.  First, the polls v. results that parallels the one above.

pozorblog-euroelection-final-poll-v-result-2004.png

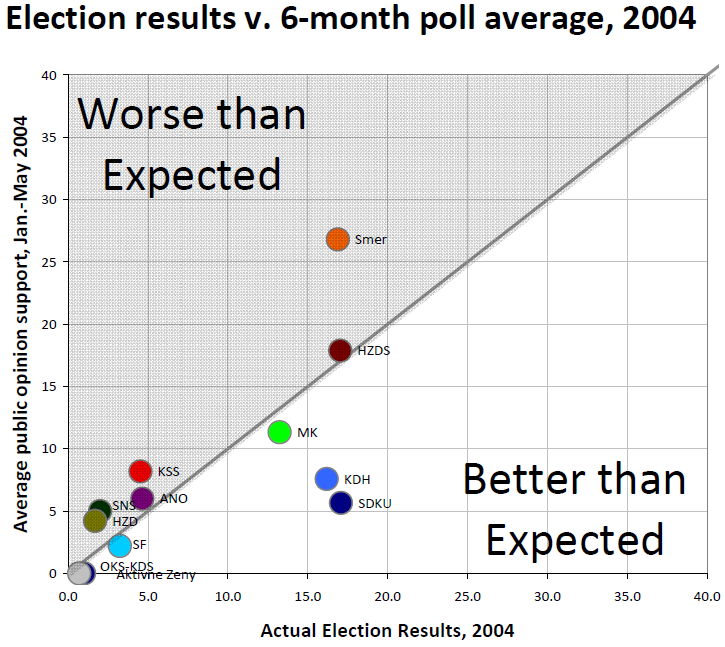
Here we see Smer’s slightly worse-than-expected performance and the dramatically better-than-expected performance of SDKU and KDH in 2004.  This is even more apparent in the poll average graph:

pozorblog-euroelection-poll-avg-v-result-2004.png

By this standard, 2004 really was a negative shock for Smer and a hugely unexpected bonus for KDH and SDKU and even to some extent for MK.  Here we see the “party organization” factor in full effect.

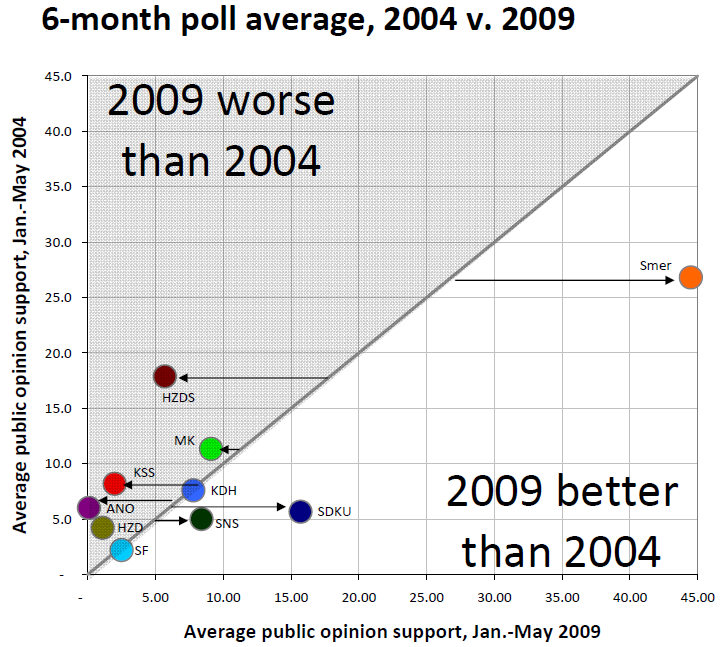
Finally, a graph that has nothing to do with the Euroelections but was calculated incidentally.  Still, it’s striking in what it shows:

pozorblog-euroelection-poll-avg-2004-v-2009.png

This blog has been talking about shifts in public opinion for some time, but this provides a great time-lapse image.  Smer is way up.  SDKU is up (though up over its polling numbers while in government rather than its actual election figures) as is SNS (though in 2004 it was coming off a disastrous couple of years after the PSNS split.  Its historical figures are actually around this level).  KDH is remarkably stable over time and has been since the mid-1990’s.  The losers are the small parties: KSS and ANO falling from electoral viability to near-death and HZDS falling from near-front runner to barely viable.  Amid all of this perhaps the most striking thing to me is the negative movement of MK.  This is a party which, except for actuarial reasons, should not move at all and yet it has fallen by several points.  Some of this may be the loss of a few Slovak voters who in 2004 still saw it as a clean alternative to the other members of Dzurinda’s then-coalition, but the party’s drop over the last 2 years suggests that it is due to poor politics.  Now we shall see what happens when there is an alternative party, but that is a topic for the next post.

European Parliament Elections: OKS-KDS

A reader (for all I know, since I haven’t enabled the statistics package on this blog, the reader) notes the OKS-KDS ties to Libertas and asks about the chances to break the 5% threshold in the upcoming European elections. My rather limited response:

This will be KDS’s first meaningful electoral test, since in the presidential elections KDS’s nearest competitor, KDH did not have a candidate.  It is good news that KDS is that it is running its best-known face, Vladimir Palko, who gets a lot of media coverage as a Slovak MP, but that’s the best news I can think of.  As far as I know, the party does not have any meaningful organization on the ground and not even, (so far as I can find) a website (and this party’s potential voters aren’t really web-readers, the absence is a sign, I suspect, of other organizational deficiencies).  Perhaps more notably, KDS has failed to get any opinion poll traction in the last year.  When it’s not explicitly included on the list of parties in polls, nobody mentions it spontaneously (“other” was for several months in several polls almost completely empty) and even when it is included, it hovers below 1%.  Perhaps worse, in the big picture, when Palko and Miklosko announced the creation of KDS the preferences for the party from which they split, KDH, did not drop at all.

OKS, for its part, may actually be slightly more organized (though that’s not saying much).  It has a few local government councilors and a website but I used to pass it’s empty, small office in Bratislava last year and rarely saw any activity and the website shows little beyond Bratislava.  OKS polled 1% in the 2004 Euroelections, and the party haven’t done anything to help itself since.

In addition to this, the field of small parties on the right is now remarably crowded and includes not only OKS-KDS but also 1) Slobodne Forum, 2) Sloboda a Solidarita, 3) Liga, and even 4) the  Demokraticka Strana (judging by its website an even paler shadow of its former pale self) and 5) Simko’s Misia 21.

The degree of alternatives raises a final, minor, question about the compatibility of OKS and KDS.  OKS may bring a little bit of organization; KDS brings a little bit of visibility (with its 4 MPs).  But at the same time, in a crowded market of small “right” parties, the combination might send some voters elsewhere.  Slovakia’s “right” is a mix of cultural conservatives and economic liberals (in the European sense) who do not always get along.  Among the mainstream parties, SDKU tends to attract the economic liberals and cultural liberals; KDH tends to attract the cultural conservatives while supporting some aspects of economic liberalism.  KDS has pushed hard on the cultural conservativism question, with strong Christian overtones whereas OKS, while not ignoring moral questions, seems shows more of an orientation toward an Anglophile conservatism rather than a religious one.  The party has few enough voters that the question may not be relevant, but I wonder whether Palko will push any OKS voters into the more economically liberal arms of Liga or SaS.

All in all, I don’t disagree fundamentally with Peter Horvath’s assessment that OKS-KDS has a better chance than many of the other smaller parties,  (http://www.panorama.sk/go/news/news.asp?lang=en&sv=2&id=19899) but that that is not saying much at all.  In a regular parliamentary election, I’d predict maybe 1.5%.  In a very low turnout Euroelection funny things can happen.  KDH significantly outperformed polling in the 2004 Euroelections, but the limited evidence I have leads me to think that this was because the party had a relatively strong organization at local levels.  KDS did not acquire those organizational assets, but KDS’s small electorate likely includes some of those high-turnout voters and maybe a few local organizers loyal to Palko, so the party may do a bit better than it would in a normal parliamentary election.