Slovakia’s politics in a nutshell

Everything you never wanted to know about politics in Slovakia and were therefore afraid to ask (lest I’d tell you).  I’ve finally had a chance to annotate an absurdly long and detailed presentation on Slovakia’s politics which derived in large part from the exercises I’ve been conducting on this blog (and past efforts).  The questions, some of which are rigorously answered in this presentation (and others of which I speed through hoping you’ll take my word for it):

  • What is politics in Slovakia about?  What is the struggle
  • Where is the power?
  • What are the parties like?  Their history, organization, voters, recent poll performance
  • What coalitions are possible after the elections?  Which are most probable?  Why?

Much of this is conjecture on my part, though I’ve tried to ground it as well as I could in data.  As always, I crave comments lest I write out into the void.

There are two versions:

Dashboard News: Unhappy Median, January 2010

medianFor once I’ll get the lead on the Slovak press and talk about a poll first, the results of which I have added to the Dashboard.  Median published its January poll results today and they have their effects on the overall averages, pushing the MKP-SMK average below 5% for the first time in my dataset, while flattening out the sharp rises of Most-Hid and SaS and softening the drop of HZDS and SNS.  We shall see how the press covers it (“CSAKY, BUGAR AND SULIK FALL SHORT!”) but in the context of other polls, its’ rather hard to accept.  There are lots of ways to analyze this but for the sake of time and simplicity I’ll simply compare Median to the other three polls taken at approximately the same time (MVK, FOCUS, Polis).  On the two biggest parties, Smer and SDKU, the Median result is right in line but on all the rest it stands out to a remarkable degree.  Long-established Slovak parties (SNS, HZDS and KDH) score high in Median’s poll.  Very high.  Meanwhile newly established parties (and SMK) score low.  Very low.  In fact, for all six of these parties, the Median poll result is not only the outlier, but its addition more than doubles the range of poll values or more (x3 for HZDS, x4 for SAS and x6 for SNS).  In other words Median results are more different from the nearest of the three other polls than any of those polls are from one another, as the graph below shows.

Where Median polls high Where Median polls low
SNS HZDS KDH MKP-SMK Most-Hid SaS
Median 9.6 9.3 11.3
Highest of other 3 polls 6.2 5.8 10 6.7 6.4 9.6
Lowest of other 3 polls 5.6 4.1 8.9 5.1 5.6 8.1
Median 3.3 4.3 2.7
Largest difference between other 3 polls 0.6 1.7 1.1 1.6 0.8 1.5
Difference between Median and nearest of other 3 polls 3.4 3.5 1.3 1.8 1.3 5.4

As I’ve discussed before, this may have a lot to do with Median’s unorthodox procedure of not providing a list of parties to choose from.  But  what to do with these results?  I’m loathe to eliminate them as I suspect they capture some kind of political truth (some people when shown names of new parties in polls pick them but revert to long standing loyalties and remembered names in the voting booth) but they do ignore another (the inability of people to remember the name of the new party they’re interested in).  And the firm’s past performance suggests that it’s take on the political truth does not much help us predict final results (http://www.pozorblog.com/?p=684).  Median may thus act as a useful corrective but simply cannot be looked at in isolation.

Polls, Politics and Parties, Part 4: Poll Predictiveness by Party, Pollster and Time

p16How well do public opinion polls in Slovakia predict election outcomes?  Well as the previous post suggests, not too well.  But they’re all we’ve got.  Of course we could always wait until the future comes to us, but, frankly, where’s the fun in that.  So rather than sit around and wait or make faulty predictions, we can try to figure out where and when the data we do have is most useful.  We can get a bit more mileage out of the data if we understand its strengths and limitations on three dimensions: time period, pollster and party   (It is theoretically possible to go further and divide it by categories within the surveyed population, but that requires the original data which is available only for limited periods and certain pollsters and so I will hold off on that for the moment.)  It is no surprise that recent data is better than old data, but even that generalization has its limits.  And while we can’t assume that polls will err in the future in the same way as in the past, it is important to know where the diversion between poll and reality crept in.

Time: Polls get better closer to elections.  Sort of.

As we elections near, shouldn’t polls become more predictive?  Yes, but not in a purely linear fashion.  I do not have a lot of data on this–only 3 elections, two of which were for the European parliament–but what I do have suggests that increases in predictiveness really only begins about 6 months before the election.  The graph below shows the differences in raw percentage points between poll “predictions” and actual results extending backward from election day.

Predictiveness of average poll results or major parties, approaching election

Predictiveness of average poll results or major parties, approaching election

There is quite a bit in these finding are news to me:

  • Improvement is not linear. I did not expect the “reversal” that occurs between one and two years out in each case–such that in each elections predictions made about 500 days before the election would be better than those made 200 days before the election.  Of course it is impossible to predict on what day to make the best predictions (for Slovakia’s parliament in 2006, T-500 days was better than T-700 or T-200, but this was not true for the 2009 Euroelections.
  • Europarliament predictions do not get better over time; Slovak parliament predictions do. Nor did I expect, though I should have, that predictions in Europarliament elections actually don’t get any better over time.  This is clearly related, I think, to the low voter turnout in Euroelections.  In this case the polls are considerably more representative than the elections themselves.  The results for Slovakia’s parliament, by contrast, have plateaus and valleys but do get closer to actual results with time.  (And one small footnote:  I worried that the results above were the result of differences in polling patterns: Slovak parliamentary elections have more polls and might therefore be more accurate.  But when I re-ran the numbers with only a single polling firm–UVVM–I got essentially the same results, suggesting that the patterns do not depend on the polling density).
  • Sharp increases in predictiveness come in the last 150 days. For two of the three polls, the best increase in accuracy came in the final five months and since today we are at entering month 4, we are already in that period.  Using these models (a rather thin basis for comparison) we could guess that we are just leaving the period of relatively low predictability and so any judgments made on the basis of polls to date should be taken with some care.  By a month out, we can make guesses about the final result that are not overwhelmingly different from the final rush of polls.  That’s not true today.

Pollster: Some firms are better than others, but not by too much

The second big question of accuracy depends on the pollster.  It may be that some firms are simply better than others and that to average them together is to inject unnecessary noise.  The graph below shows the errors in poll predictivness for each major polling firm’s final pre-election survey in four elections:  Slovakia’s parliament in 2002, Europarliament in 2004, Slovakia’s parliament in 2006 and Europarliament again in 2009.  Gray boxes mark “final” polls taken more than a month before the election.

Poll predictivness by pollster 2002-2009

Errors in poll predictivness by pollster 2002-2009

In this case the data–closer to the bottom means less error and more predictiveness–lends itself to several relatively clear conclusions (the full data set is at the bottom):

  • Slovakia’s parliamentary elections produce small differences. During parliamentary elections–the first and third clusters–all firms tend to cluster closely together with a very small difference among them.  These surveys tend to be large enough and carefully-enough framed, and with voters sufficiently politicized that the polls tend to converge around a single answer.   The only exceptions here–Median and FOCUS–are not exceptions at all since these (like Median in 2009) are polls taken a month previously and (as the previous section shows) a month makes a some degree of difference (about 0.5 or so).
  • Europarliament elections produce bigger differences. During Europarliament elections the spreads are much greater and the number of pollsters much smaller.  Here the differences among pollsters would matter (if Slovaks felt that the elections themselves actually mattered, which most appear not to do).

With regard to specific pollsters, two stand out, but they have either ceased their work in this or work quite infrequently:

  • UVVM was an excellent pollster and the decision by the Slovak Statistical Office not to continue these tests is a big loss.
  • OMV does good polls.  It’s a pity they only do them immediately before elections.  (As an aside, no matter how good its polls may be, they cannot be used as a substitute for exit polls, as STV tried to do in 2006.  Even the best, biggest pre-election poll seems destined to miss something).

Of the pollsters who still regularly poll (and with the exception of MVK, post results with increasing regularity) we can say the following”

  • FOCUS has done a mediocre job in parliamentary elections but an excellent job in Euroelections.   Without UVVM it is at the most reliable remaining pollster
  • MVK, by these same calculations has done slightly worse than FOCUS but it too remains fairly solid.
  • Median has not done as well and has been the high-end outlier in the two most recent elections (in 2009 its poll was taken a month before the election but its errant 2006 poll was taken in the final rush).  This may be the result of Median’s open-ended preference question that does not as closely resemble the ballot process.
  • The big surprise, and perhaps it is simply a coincidence, is that the telephone poll conducted by Polis in 2006 actually came close to the mark.  Telephone polls have faced considerable criticism in the past, including my own, but this one worked.  The 2010 election will provide a major test of its reliability.

Finally on the question of pollsters, it may be that no pollster is better overall but that some may be better or worse in detecting support for particular parties.  As the Dashboard shows to even a casual observer (and as I will try to analyze in greater depth nearer to the election), some parties tend to do consistently better in some polls than in others.  Does this translate into differences in electoral predictiveness?  Again we face here a lack of data but what we have yields several conclusions about past patterns, though these are not particularly useful predictors for the future as they reflect a difference of at most a few points from the results of other pollsters.  Nevertheless, we can say that compared to other pollsters,

  • UVVM’s estimates for SDKU in all elections are less than those of other pollsters and its estimates for SNS and KDH are less than those of other posters in parliamentary elections.  UVVM also overestimated HZDS in almost elections.
  • OMV has underestimated Smer in parliamentary elections and underestimated SNS and KSS in parliamentary elections
  • FOCUS has consistently underestimated HZDS and KDH, and has slightly overestimated Smer in parliamentary elections (while slightly underestimating the party in Europarliament elections).  It has also slightly overestimated KSS in parliamentary elections
  • Median has overestimated Smer in both elections for which we have its data and has underestimated SMK and HZDS and KDH (all rural parties, suggesting a weaker rural network of poll takers)
  • MVK has overestimated Smer and KDH in parliamentary elections and underestimated SNS and KSS.
  • With only one poll in, we have no way of making a broader assessment for Polis,  but I for one will be very interested to see what happens next.
  • Postscript: Just discovered this article about accuracy of presidential election results.  It corresponds roughly to parliamentary election results with reasonable results for FOCUS, MVK and, surprisingly, Polis.  See http://volby.sme.sk/c/4360649/statna-agentura-odhadla-vysledky-katastrofalne-a-facebook.html

Party: Some parties outrun the polls (sometimes)

The most interesting question is whether polls as a whole tend to over-estimate or underestimate the electoral support of particular parties.  This is a rather easy circumstance to imagine:  the networks of pollsters do not extend to the ethnic or class group in which a particular party is strong, or a particularly segments of a party’s support base are overwhelmingly less (or more) likely to actually get out to the polls.  The graph below lays out the differences between the averages of the final polls (white circles) and parties’ actual election results (color coded circles) for four elections: the parliamentary election in 2002, Europarliament in 2004, parliament again in 2006 and Europarliament again in 2009.  The arrows (thick for parliamentary, thin for Europarliament) point from the poll prediction to the actual result.

Poll predictivness in Slovakia 2002-2009

Only for a few parties do these arrows show clear patterns over time:

  • SDKU has been underestimated by polls all four times, though the gap has narrowed considerably.
  • SMK has also been underestimated, though by smaller amounts (and the gap in 2009 is the result of the emergence of Most-Hid which did not run candidates)

For several other parties patterns are less distinct:

  • KDH and HZDS have been underestimated in Euroelections but results in parliamentary elections produce no clear result.
  • For SNS there is likewise no clear pattern in parliamentary elections but a pattern of overestimation in Euroelections.

The biggest question, of course, is Smer, a party whose poll predictivness becomes an intensely political question.  The results here suggest:

  • A pattern of consistent overestimation in the polls by significant numerical (and even percentagewise) amounts in Euroelections and the 2002 parliamentary election…
  • BUT (and this is a very important but) in the well-polled 2006 parliamentary elections the polls actually slightly underestimated Smer’s performance.

The Smer problem here is simply a large-scale representation of the problem that we find here in trying to make predictions against a moving target (the relationship between party poll support and voter turnout) and with very little data (N=2 for each kind of election).  (Still, for those who are interested, I include the full data at the end of this post.)

This question has driven experts to find a variety of proxy measures to figure out how to adjust polling numbers to reflect the final outcomes.  This post is already too long, however, so that will have to wait for another post (and lest this seem like an unfair cliff-hanger, know that the efforts so far have not produced a particularly compelling answer).

Data Tables for the Obsessive (by the obsessive)

Election Party Major parties Smer SDKU SNS SMK HZDS KDH KSS HDZ ANO PSNS SDA SDL SF All Parties
2002
Slovakia
Average +2.0 +3.8 -4.7 +0.8 -0.9 -0.8 -0.8 -2.1 +2.0 +0.8 -0.5 +0.3 +0.6 +1.5
OMV-SRo +1.8 +2.3 -5.6 +1.6 -0.4 +1.0 -0.5 -1.2 +1.9 +0.3 -0.5 +0.6 +0.6 +1.4
UVVM +1.8 +1.7 -6.6 +0.3 -1.1 -0.8 -1.1 -1.4 +2.1 -0.2 -0.7 -0.4 +1.4 +1.5
Markant +2.0 +4.3 -4.2 +0.7 -2.3 +0.5 +0.4 -1.8 +1.1 +1.0 -0.4 +0.2 +0.6 +1.5
Dicio +2.1 +4.2 -2.8 +0.4 -0.8 -2.2 -1.4 -3.0 +2.8 +1.4 -0.6 -0.2 +0.2 +1.7
MVK +2.3 +5.0 -4.7 +0.4 -0.8 -1.9 +0.1 -3.5 +1.2 +1.0 -0.3 +0.8 +0.2 +1.7
FOCUS +2.3 +5.2 -4.6 +1.4 -0.1 -1.4 -2.3 -1.5 +2.8 +1.2 -0.6 +0.7 +0.8 +1.9
2004
Europarliament
Average +4.3 +9.0 -8.5 +1.8 -1.7 -0.9 -7.0 +1.1 +2.4 +0.5 -0.4 +3.5
FOCUS +3.0 +0.7 -7.9 -1.1 +0.4 -1.4 -8.4 -1.3 +3.2 +1.6 -0.4 +2.6
OVM +4.5 +8.5 -7.3 +3.4 -2.9 -1.6 -5.6 +2.0 +2.1 +0.6 +0.4 +3.3
UVVM +5.0 +13.3 -9.2 +2.7 -2.1 +1.0 -6.9 -0.1 +2.6 +0.1 +0.2 +3.8
Dicio +5.7 +13.4 -9.6 +2.4 -1.9 -1.5 -7.1 +4.0 +1.8 -0.3 -1.8 +4.4
2006
Slovakia
Average +2.2 -1.6 -5.3 -1.7 -1.4 +2.7 +1.4 +1.2 +0.7 +0.8 +2.6 +2.0
OVM-Sro +2.0 -2.4 -4.8 +0.1 -1.7 +1.5 +1.3 +2.0 +0.9 +1.3 +0.8 +1.7
Polis +2.2 -2.5 -4.7 -1.1 -0.4 +2.5 +3.3 +0.6 +1.4 +0.8 +0.3 +1.8
UVVM +2.2 -0.6 -5.7 -2.0 -1.4 +4.1 +0.6 +1.2 +1.7 +0.9 +1.1 +1.9
MVK +2.3 -1.1 -5.9 -1.7 -1.7 +2.7 +2.2 +1.1 -0.6 -1.4 +2.5 +2.1
Dicio +2.4 -1.1 -5.7 -3.5 -2.0 +2.7 -0.2 +1.2 +0.4 +2.7 +5.0 +2.5
FOCUS +3.2 +2.6 -8.9 -3.6 -1.9 +2.3 +1.4 +1.6 +1.6 +2.0 +2.5 +2.8
Median +3.4 +0.7 -10.6 -3.6 -3.2 +1.8 +1.1 +2.7 +3.5 +1.1 +5.5 +3.4
2009
Europarliament
Average +3.9 +11.9 -2.6 +5.0 -3.5 -2.2 -1.6 -0.2 -0.4 +3.6
FOCUS +3.3 +8.4 -1.2 +3.4 -2.7 -3.7 -2.6 +1.1 +0.8 +3.0
UVVM +3.6 +11.7 -4.5 +5.0 -2.8 -0.5 -0.3 -0.0 -0.4 +3.1
MVK +3.9 +11.0 -1.6 +4.8 -3.0 -2.9 -2.7 +1.0 +0.9 +3.5
Median +5.0 +15.8 -2.0 +6.5 -4.8 -2.6 -1.9 -1.7 -1.6 +4.6

dd

Party Parliamentary Election Year Poll Avg. Result Raw Poll Error % Poll Error Average Poll Error Consistency
Smer Slovakia 2002 17.3 13.5 3.8 28% 12% Mixed
2006 27.6 29.1 -1.5 -5%
EU 2004 25.9 16.9 9.0 53% 46% Consistently too high
2009 44.3 32.0 12.3 38%
SDKU Slovakia 2002 10.4 15.1 -4.7 -31% -30% Consistently too low
2006 13.0 18.4 -5.4 -29%
EU 2004 8.6 17.1 -8.5 -50% -27% Consistently too low
2009 16.1 17.0 -0.9 -5%
SNS Slovakia 2002 4.1 3.3 0.8 23% 5% Mixed
2006 10.1 11.7 -1.6 -14%
EU 2004 3.9 2.0 1.9 94% 79% Consistently too high
2009 9.1 5.6 3.5 64%
MK Slovakia 2002 10.3 11.2 -0.9 -8% -10% Consistently too low
2006 10.3 11.7 -1.4 -12%
EU 2004 11.6 13.2 -1.6 -12% -26% Consistently too low
2009 6.9 11.3 -4.4 -39%
HZDS Slovakia 2002 18.7 19.5 -0.8 -4% 13% Mixed
2006 11.5 8.8 2.7 31%
EU 2004 16.1 17.0 -0.9 -6% -24% Consistently too low
2009 5.2 9.0 -3.8 -42%
KDH Slovakia 2002 7.5 8.3 -0.8 -9% 4% Mixed
2006 9.7 8.3 1.4 17%
EU 2004 9.2 16.2 -7.0 -43% -28% Consistently too low
2009 9.4 10.9 -1.5 -14%
KSS Slovakia 2002 4.2 6.3 -2.1 -33% -1% Mixed
2006 5.1 3.9 1.2 31%
EU 2004 5.7 4.5 1.2 26% 29% Consistently too high
2009 2.2 1.7 0.6 33%
SF Slovakia 2006 5.4 3.5 1.9 56% 56% No data
EU 2004 2.9 3.3 -0.4 -11% 11% Mixed
2009 2.1 1.6 0.5 33%
HZD Slovakia 2002 5.3 3.3 2.0 61% 113% Consistently too high
2006 1.7 0.6 1.1 166%
EU 2004 4.1 1.7 2.4 143% 143% No average
ANO Slovakia 2002 8.8 8.0 0.8 10% 53% Consistently too high
2006 2.8 1.4 1.4 97%
EU 2004 5.2 4.7 0.6 12% 12% No average

Polls, Politics and Parties, Part 3: How predictive are polls in Slovakia?

Bep4fore launching into an extended discussion of public opinion in Slovakia, I thought it would pay to look at the quality of the tools we actually have.  I approach this, however, as a non-specialist and look forward to input from others on how this compares to other countries and how better to measure what I am trying to get at.

I also undertake this knowing that whatever the results, I will still look at the topography of party support based on polls.  They are the proverbial lamppost under which we search for our lost keys–the keys may not be there but everywhere else is too dark.

Finally, I distinguish here between accuracy and predictiveness.  I have little doubt, knowing the experts who do this work in Slovakia, that the polls get a read on Slovak opinion that is close to what people actually think (sometimes better, sometimes worse but usually close).  That is not the same, however, as figuring out which of those people will actually come out to vote and how they will make up their minds in the voting booth itself.  When I talk below about “error,” I talk about the difference between what polls say and how ballots are actually cast rather than to mistakes by pollsters.  There may be a technical term for this that I don’t know and I’d be happy to learn it.

From the perspective of somebody who wants to know the result–or wants to make some money in the odds markets, the prediction value of polls for all elections in the sample (Slovakia’s parliament in 2002 and 2006, the European parliament in 2004 and 2009) is not particuarly encouraging.  The difference between results and the average of final polls was 2.5 percentage points which is 36% of the value of the actual result for the parties in question.  Even among major parties in higher turnout parliamentary elections of 2002 and 2006 the average poll got the average party result wrong by an absolute value of 2.1 percentage points or about 24% of the party’s actual result.  The maximum error recorded was 5.4 percentage points (31%). While some polls occasionally came close on specific parties, the poll average never did better than 0.8 percentage points (4%).

Nor do the levels of error seem to be decreasing.  In fact the levels and percentages of error are remarkably consistent from one election to the next when differentiated by the category of election.

Parliamentary Election Year Raw poll error % poll error
Slovak 2002 2.0 24%
2006 2.1 24%
Europarliament 2004 4.7 32%
2009 4.4 34%

This means that any guess about any party’s electoral results based on average public opinion polls, whether made in this blog or anywhere else is, at best likely to be 5% off in either direction and that the error will average (if the past is any guide, as it seems to be) around 24%.  For a party exactly at the 5% threshold, a 24% error produces a range between 4.0 and 6.25.  For a party with 30% support, that same average error produces a range between 28.0 and 43.75!  For low-turnout European parliament elections the potential range is even wider.  This resulting range is the combination of normal margins of survey error (a small part of the total) and a much larger component related to the likelihood of people to actually turn out to vote, regardless of their preferred parties.

The task, then, is to figure out whether there are any ways to figure out specific locations where the errors are likely to emerge and to try and correct for them.  This means looking specifically at time periods, parties, and polling firms, something I will do in the next post.

Parties, Polls and Politics in Slovakia: Part 1 of a multi-part series.

p0Lots of news from Slovakia in the past two weeks, some obvious and some not. In addition to changes in Slovakia’s leading opposition party SDKU-DS, the reports of recent days have also included a series of other minor revelations and lots and lots of polling data including some new sources.  I’ll try to address some of the quick and ephemeral issues in the next blog entry and then on to something more systematic.

It is my hope over the next several weeks to look at Slovakia’s party system in some detail as summary of the year past and preparation for the busy electoral season ahead (though the campaign’s been in full swing since Christmas). In particular I want to look at long term polling data for each of the major parties, looking at trends in support, the relationship of poll numbers to internal party politics and the relationship of polls to election results.  I’ll be posting those as “Parties, Polls and Politics” and tagging them as “ppp” and they’ll serve as the basis of better analysis come election time.

September 2009 Poll Results: Whither Smer?

This post comes a bit late because of changes to the pozorblog site but the month’s news is important enough to warrant an interim post.

Things only changed a little this month. But small changes from one month to the next add up. And this month not all the changes are small. A few areas to watch.

Smer

September 2009 Graphs_Page_01

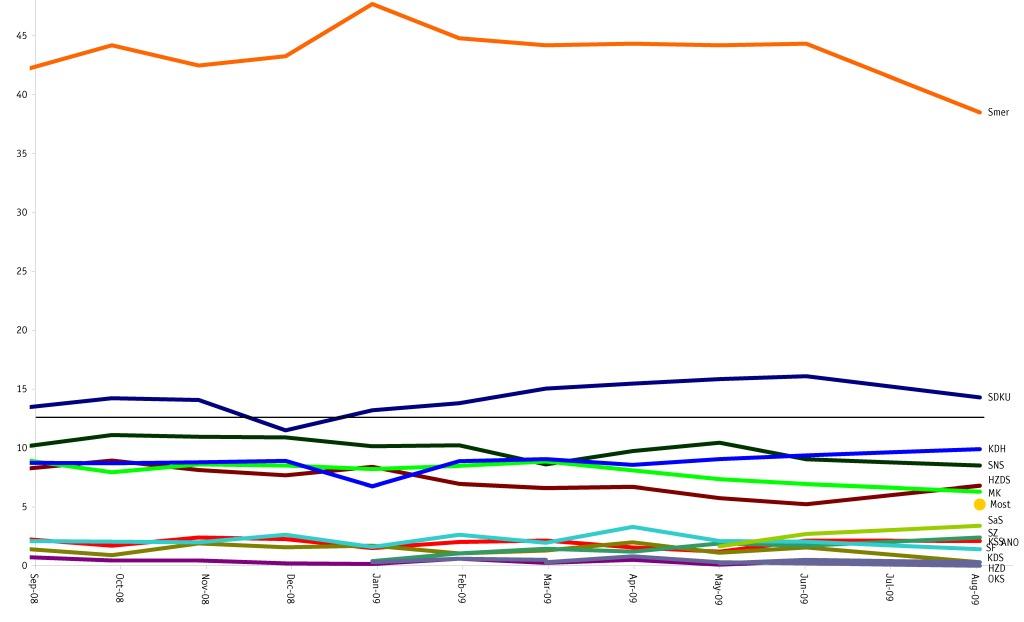
As the image shows Smer remains far above its nearest competitors–still well over double the preferences of SDKU. But the last four months have seen a drop in Smer preferences from the mid-40s to the high-30s. This shift is primarily in FOCUS polls, however, and it is difficult to say whether the result is “real” or some sort of blip. Median, the only monthly alternative, shows no similar drop. I am really missing UVVM this month as it was always helpful to see what a second pollster said before making a judgment, and MVK polls are as unpredictable–in their appearance, not their results–as weather.

September 2009 Graphs_Page_05Closer look at Smer polls over time show a gradual increase over the last two years peaking in a cluster in late 2008 and then reverting back to the previous plateau and now, again to a lower level, though whether that lower level is part of a plateau or a slope is something we will have to see about. I suspect next month will show Smer higher in Focus polls but lower than its average level for the last 5 months. I suspect this month’s drop is a bit of an outlier, just as its previous peaks did not always sustain themselves and appear to be noise rather than signal.Smer doesn’t have too much to fear–it’s still hard to calculate a way that it won’t be in the next government, but it wouldn’t surprise me if some mid-level Smer types were starting to work on their political insurance policies.

SDKU and KDH:

September 2009 Graphs_Page_02
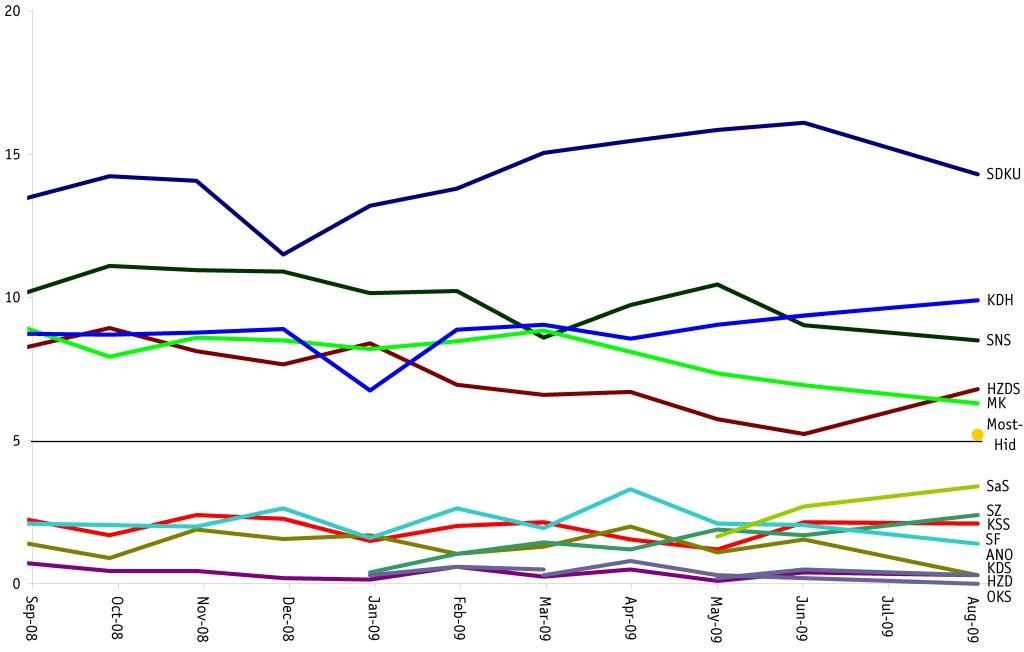
Take Smer out of the graph and it looks more like a competitive party system. And this fall for the first time in a long time, the two top competitors to Smer are both from the opposition: SDKU and KDH. SDKU dropped slightly this month in FOCUS polls but it’s still near a historic high (in the past it would do this well in elections but not in polls). Some of its slight decline may relate to the rapid resurgence of KDH, a party that has taken a sudden upward jump due, I must think, to the energizing presence of Jan Figel, former European Commissioner. I am interested to see whether Figel’s more proactive approach will keep the party preferences high. In some sense, this does not help the opposition much, since those attracted to Figel are probably those who would otherwise hold their noses and vote for SDKU, but since they might also vote for SaS, it keeps votes among the larger opposition parties. Thumbnails for SDKU and KDH are here:

SDKU——————————————————– KDH

September 2009 Graphs_Page_06September 2009 Graphs_Page_10


HZDS and SNS:

Slovakia’s two minor governmental parties continue their respective slow slides, partly the result of Smer’s remarkable skill at picking off their voters and partly the result of their own internal struggles and disadvantages. HZDS has stopped falling for the moment but given the party’s steady 10 year slide and absence of anything new that might recommend it, it is hard to imagine anything but continued decline (with the key question: 5% or not 5% next June). SNS’s decline has been disquised at times by the party’s erratic support shifts but it is notable that all of the trendlines (24-month, 12-month, 6-month and 3-month point down at almost the exact same angle). The party has more leeway for falling than HZDS but it is not immune, and at some point SNS mid-level leaders are going to need to decide what to do if they feel that Jan Slota is pulling them down. The party’s structures are so focused around the party chair that the only way to force change will be to leave, but the last time they did that the parties split the electorate 50/50 and neither got into parliament.

SNS——————————————————– HZDS

September 2009 Graphs_Page_07

September 2009 Graphs_Page_09


SMK
and Most-Hid

Not much to say here, yet. For two polls in a row both parties are poised to make it into parliament. If this can continue then Bela Bugar has done a big favor to the Hungarian electorate, bringing back those disenfranchised from SMK. If both don’t stay above 5 and neither drops to near-zero, then the Hungarians will see their poorest electoral showing since the early days of Slovakia’s democracy. I’d be keen to hear any thoughts from Magyarophones about what to expect here as this is a subset of the population from which I hear little direct news.

SMK (regular graphs for Most-Hid coming soon)

September 2009 Graphs_Page_08

Smaller Parties:

Not much news here this month. SaS shows staying power at around 3%, and KSS recovered this month to its traditional 3% levels as well (though it has not been there for awhile). Below, around 2% stands SF (recovering slightly from a major drop the previous month) and at at the flatline level are OKS, KDS, ANO and Liga (which didn’t get a single person to mention it’s name this month even though it’s on the list). Between them are two more: HZD (slightly higher than expected–it’s been flatlining) and the Greens (somewhat lower than expected–last month it even beat KSS).

What it all means? The Coalition Partner Game

It’s still Smer’s ballgame, but coalition politics could become extremely interesting if Smer does end up at around 35% and HZDS or SNS fall below 5%. It is dangerous to trust what parties say about potential coalition partners, but as of now, SDKU and KDH appear to have ruled out coalition with Smer (Dzurinda is right, I think, to note that such a coalition would severely hurt his party, and he doesn’t have the organization or track record to ride it out the way ODS and CSSD did with their opposition agreement in the Czech Republic). But if this option truly is gone, then there are few other combinations that can make 50%. If the existing coalition can’t muster 50% because one party drops off, then Fico would need to find alternatives, but (even though I generally do not rule things out) there will be no coalition containing both SNS and either SMK or Most-Hid, and SaS, the only other party that looks now to have a chance, has promised up one side and down the other that it will not join forces with Smer. So Smer’s only real chance is probably SNS+HZDS or so many votes for parties that fall below the threshold that it can with SNS or HZDS form a bare majority government.

At the same time, there’s not much hope for a government of the current opposition parties. Even with SDKU and KDH and SMK and Most-Hid and SaS, there’s nothing like a majority. It might be possible to create one by adding HZDS to this but even that’s unlikely and HZDS is the party in greatest danger of falling short. In 10 short years, HZDS has gone from a huge and polarizing force in Slovakia’s politics to a tiny but necessary coalition partners. The more things stay the same, the more they change.

Wanted: Effective journalism in Slovakia

Median logoI know Slovakia’s journalists are overtaxed with all that is required of them, but there are things they could do to make things better without too much extra work.  Case in point: today all major Slovak news sources today report, almost word for word, a press release from the firm Median reporting poll results from July:

The reports differ a bit, of course: SME and TA3 have a graph, Pravda has a table with past results from Median, HN relates the results (with no actual evidence) to the effect of recent scandals.

What none of them does is to answer the important question about Most-Hid.  Median, for reasons that are not clear, does not report on parties that do not cross the 5% threshold, and all the papers report that fact.  What they do not do is to say just how well Most-Hid actually did.  Here’s where journalism comes into play.  If the role of journalist goes beyond simply typing (or in this case probably pasting what others send to you) then it may be to try to find answers to important questions.

So here’s my suggestion: call Median and ask them 

If Median won’t answer, ask them why.  Focus reports its polling results with an extremely detailed and effective one-page report.  UVVM used to do the same.  There is no reason the papers should print Median’s results unless they are willing to rise to the same (bare minimum) standards. If Median won’t play that way, write a story about the fact that Median won’t provide necessary information):

If Median won’t answer and you still want to figure out something about Most-Hid’s initial support (a quite important detail), here’s my second suggestion: do some math.

If you add up the total support for the parties listed by Median in past polls, you get a consistent result of about 97% for May and June.  That means other parties are getting about 3% (specifically 3.1% in May and 3.3% in June).  If you add up the total support for July you get 92.3%.  That means other parties got 7.7%.  Of course this doesn’t tell you how well particular parties did, but it’s worth reporting that the “Other” number rose by 4.4% and citing the FOCUS numbers which show that support for below-threshold parties actually did not change systematically during the same period (9.0% in May, 12.5% in June, 10.2% in August), meaning that a large share, of not all of the 4.4% probably went to Most-Hid.

Total cost of these important details: one phone call and/or 2 minute 3o seconds of addition and subtraction.

If this lack of effort applies in this specific area, it’s probably also true in areas where I do not read.  It’s time for Slovaks to demand better journalism.

August 2009 Poll Results: Bending The Mold

Poll results, last 12 monthsThe pattern looks familiar and the lines haven’t changed much, but there are a few ways that this month’s results by FOCUS change our understanding of the current political competition.

I have actually been fearing this change for a long time–not because of the actual politics involved but because of the emergence of a new party.  The graphs in this blog are the product of a long and complex process of fighting with Excel to produce results that can be read by Google’s chart API (about which I understand little, but which is quite remarkable).  That process has produced an elaborate set of calculations which are, unfortunately, based on the presumption of a certain set of parties (and only those parties) gaining election to parliament.  This month holds quite a few big changes in public opinion and one of those–the emergence of Most-Hid with just over 5% of the vote–means that my old systems won’t work anymore.  This is good news, in a sense, because it gives me the impetus to find a solution that will not require as much work (calculating in Excel, creating the google charts, posting separately to Google Docs), but for the moment it makes things more difficult.  I will therefore resort to Excel charts for awhile.  And now, after that pointlessly detailed introduction (I buried the lead again), the graphs and then some thoughts on anybody should care:

Poll results, last 12 months

And the same graph without the distorting scale effects of Smer:

Poll results, last 12 months minus Smer

1. Most-Hid might make it into parliament
This may not be a surprise (Bugar is quite popular among Hungarians) but it is important, and the way the numbers fell is important in several ways:

  • Most-Hid v. SMK is not exactly a zero-sum game.  This month’s 5.3 score for Most-Hid came at relatively little cost to SMK which has dropped only about 1 percentage point in the last 4 months.  Of course SMK has dropped quite a few percentage points since Csaky became party chairman (and even before while Bugar was still chair) but it would appear that the party has brought disaffected Hungarians back into the political system rather than stealing directly from SMK.  As a result, Hungarian parties combined scored the best public opinion result that Hungarian parties have received in almost 5 years (since January 2005).  All of the opposition’s gains this month can be traced to that single re-mobilization.
  • Both can get into parliament.  There has been some discussion about whether the two parties might split the vote down the middle (as SNS and PSNS did in 2002) and lose representation altogether.  The results from today suggest that a 50-50 split is actually an ideal result for the Hungarian population in Slovakia.  More worrisome would be a 60-40 split, cutting the Hungarian representation nearly in half.  Of course there are some who suggest that infighting among Hungarian parties could disaffect enough to push Hungarian turnout so low that a 50-50 split would deny representation to both, but this month’s good results come after bitter conflict, so it is hard to imagine how bitter the conflict would need to become to provoke the worst case scenerio.
  • Things are far from over.  It may be that these two parties split the Hungarian vote.  It is more likely that one will tend to prevail over the other, either Most-Hid because of more dynamic leadership or SMK because of stronger organization and tradition.  This is one of the keys to the outcome of the next election so it bears considerable watching.

2. SaS has a (small) chance
This is something of a stretch because the party is only at 3.4%, but unlike the other small parties on the “right” it shows a positive trajectory.  KDS has stalled below 0.5%, and Liga appears stillborn (in eight months of polls the party has racked up a total–not average, total–of 1.4%).  OKS and ANO are effectively dead and DS and Misia21 exist only on paper (and barely there).  The big loser in this is probably Slobodne Forum which looked to be doing well in late spring, but SaS’s much better performance in the Europarlament elections appears to have given it the edge.  We have too little data to tell if it is a meaningful pattern, but SaS’s growth so far has been almost perfectly proportional to SF’s decline.

3. Smer’s recent decline continues
There is no real cause for gloom in the party (it is still almost three times the size of the next largest alternative) but it has dropped by nearly 10 percentage points from its (admittedly unrealistic) peak of early this year (when it was four times the size of the next largest alternative).  Since the 2006 election the party has peaked and waned five times, so the variability is nothing new, but this is the first time that the party has dropped sharply from a plateau rather than from a peak.  Of course it is safe never to rule out the possibility of recovery to new heights, but it is more likely that the weight of a poor economy and a large number of corruption scandals, some perhaps not so minor, have begun to take away some of the luster.  This may not be a huge loss for the party as many of those shifting away are likely the supporters who wouldn’t bother to turn out to vote for it (as they didn’t in the Europarliament elections).

How it adds up (Smer’s threshold for success)
The big question is the intersection of the points above:  the emergence of Most-Hid creates two parties that may or may not pass the 5% threshold.  SaS adds a third.  HZDS is the fourth (the party got a slight reprieve this month but even with that the 6-month, 12-month and 48 month trendlines show it dropping below the 5% threshold by spring and only the 24 month trendline puts above by about 0.5 percentage points, though the party’s loyal base also makes it necessary to adjust the numbers upward a bit in its favor).  Since each of these parties could dispose of between 3% and 6% of the overall vote and since the magical 5% makes or breaks the party’s parliamentary representation, a lot will be riding on the results.  My preliminary calculations suggest that in a worst case scenario for Fico–if SaS, Most-Hid, SMK and HZDS all made it into parliament–Smer would need 41% to be able to form  a two-party government with SNS (assuming that SNS’s preferences do not also continue to decline), though it could also settle for a three-party coalition identical to the current one (and it could sustain that coalition even if its own preferences dropped as low as 31%).  If HZDS failed to pass the threshold, Smer would gain some seats from the redistribution but not enough to overcome the loss of a potential coalition partner:  if HZDS falls and both Hungarian parties and SaS survive, Smer would need all of its current 38% to form a two party coalition with SNS.  Of course it is unlikely that all three of the smaller opposition parties would succeed.  If one of them fails, Smer could get by with 33% and if two of them fail, the Smer could form a majority two-party coalition even if it got only 28%.

This all deserves more thought and calcluation.  With any luck I will have opportunity to do just that.

Less than perfect public opinion coverage in Slovakia

 [Citajte post aj po slovensky]

“Less than perfect” could be the title of nearly post on polling coverage in Slovakia (hence, in many ways, this blog), and I shouldn’t be too critical but today both major papers went out of their way to mangle polling data.

In SME: “New party Most already clearly drawing Csaky voters” cites a Polis poll showing SMK at 5.7%.  Not only does the paper fail to assess whether Polis does good polls (they use telephone surveys which are problematic and they haven’t released a party poll for a long time so we just don’t know for sure–but more on that in a later post) but it suggests a trend–and a causal relationship even–on the basis of one data point.  We simply don’t know how SMK polled in previous Polis polls this year because there haven’t been any (at least I haven’t seen any and the paper certainly doesn’t provide them, using the 2006 elections as a frame of reference, as if that told us about polling trends).  Other polls did show SMK higher in previous months, but all polls do not sample populations the same way, and even UVVM had trouble with even samples of the Hungarian population (http://www.pozorblog.com/?p=110), and showed a result for SMK as low as 6.7% in September of 2008.  I’m not saying that Most-Hid is not pulling away SMK voters–in fact I suspect it is–but there’s no way of knowing it from the information we’ve got here.

In some ways worse, both SME and Pravda use the same data set to talk about the woes of HZDS.  SME simply makes the same mistake as above, suggesting that “HZDS continues to decline” on the basis of only the one Polis poll, without attending to the fact that different polls show different levels for parties and ignoring the fact that this month’s FOCUS poll show’s HZDS rising by more than a point, from 4.2 to 5.3.  Pravda’s story, “Meciar not bothered by polls does something rather worse, citing not only the Polis poll but also the numbers from FOCUS for April (4.8) and May (4.2) without feeling obliged to report the big increase reported in June.  It is clear to me that HZDS is in trouble, (and these microtrends usually don’t add up to anything, so I wouldn’t argue that HZDS support is actually increasing), but citing the first two numbers of a sequence of three seems a bit beyond the pale when the third number tells the opposite story.

June 2009 FOCUS Results

FOCUS Monthly Report, June 2009

[Citajte post aj po slovensky]

With no more results from UVVM to kick around anymore and only irregular announcements from MVK, we’re left with FOCUS (quite a good poll but it was always better to have a comparison set) though “Median” appears for better or worse to be filling some of the void (more on this in a future post).  As a result, I’ve temporarily adapted my monthly tracking graphs from UVVM to FOCUS and will use those until I can shift to a new visualization system this fall (with any luck).

UVVM+poll+data+ for +all+parties+ for the most recent +24+months+ in Slovakia
This overall long-term graph of poll results for FOCUS shows, amid the overall stability, several minor shifts, most notably a drop in Smer, fairly consistent over the last months (and also suggested in the final, unpublished UVVM numbers) from its highs at the beginning of the year. Given past disastrous guesses, I’ve withheld judgment on this, but, I’d now guess that January 2009 might prove to be Smer’s all time record high point (more on that in a later post).  Also obvious is SDKU again separating itself from the pack in the middle, both because SDKU is doing better and because its closest competitor, SNS is doing worse.  That middle “Gang of 5” parties all around 9% has largely disappeared now that SDKU is doing so much better and because HZDS is doing so much worse (though it has picked up slightly this month and moved back above the 5% threshold).  In fact HZDS is now closer in preferences to KSS and SF than to any of the current parliamentary parties (Median’s numbers for HZDS are higher).  The gang of 5 is likely to disappear altogether next month if Most-Hid manages to pick up a significant number of SMK voters.  Over the coming months I will be reworking the system to include the many smaller parties that have emerged of late and about which FOCUS now asks explicitly.  For the moment it is worth noting that the Greens (SZ) and Freedom and Solidarity (SaS) now accompany KSS and SF in the 1-3% range whereas the Conservative Democrats (KDS), Civic Conservatives (OKS) and Civic Liberals (Liga) languish with ANO and HZD under 1%.
UVVM+poll+data+ for +all+parties+except+Smer+ for the most recent +4+months+ in Slovakia

As a result of these shifts the long-term graph of poll results for coalition and non-coalition parties shows something of a narrowing, though not one that should give too much joy to the current parliamentary opposition, because a large and increasing of those “non-coalition” votes are actually votes for parties that are either not ideologically in sync with the current opposition (KSS) or parties that probably won’t make it into parliament unless there is some consolidation of small parties on the right (SaS, SF, Liga, ANO, KDS, OKS).

UVVM+poll+data+ for +coalition+support for the most recent +24+months+ in Slovakia

The long-term graph of poll results for (loosely defined) party “blocs” parties shows a steady drop over time for the more explicitly national parties (though recovering a bit in the last three months from record lows, with many of those voters apparently shifting over to Smer while the “right” remains relatively stable (this graph does not include the non-parliamentary parties on the right).

UVVM+poll+data+ for +party+'blocs'+ for the most recent +24+months+ in Slovakia

For all these slow shifts, Smer is in no danger yet of needing two coalition partners.  One will do.  Though speculation has involved the possibility that the “one” in question might be SDKU, I suspect that if things stay as they are, Fico’s partner will be whichever party is weakest and least likely to threaten Smer’s control.

Multiple-poll+average+ for +estimated+party+seat+distribution for the most recent +1+month+ in Slovakia

Multiple-poll+average+ for +estimated+party+seat+distribution for the most recent +24+months+ in Slovakia

Sorry, but I won’t be posting of full poll numbers this month or any time soon until I get the new system worked out.  More soon on the polls by “Median”.