I learn visually and so to learn about my own community, I graph how people vote. Just a few quick thoughts here about what the 2016 presidential primary tell us about my part of southeastern Oakland county.
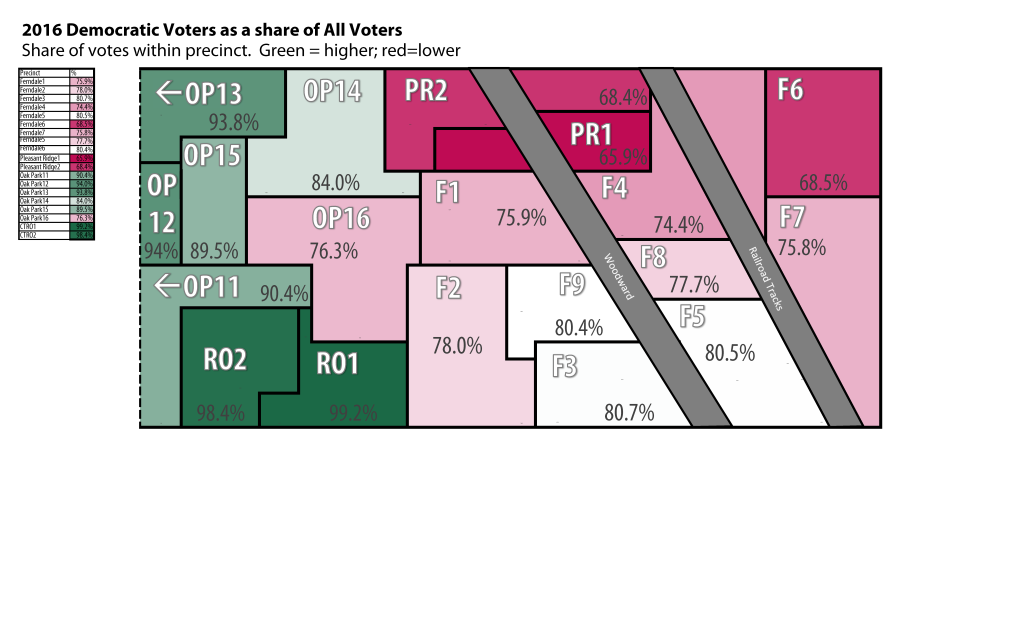
First, wealthier citizens vote. I don’t have the census tract stats on income or education immediately at hand, but these green spaces correlate quite closely with the education-income corridor that intensifies as Woodward heads north. This relationship is quite linear and self explanatory.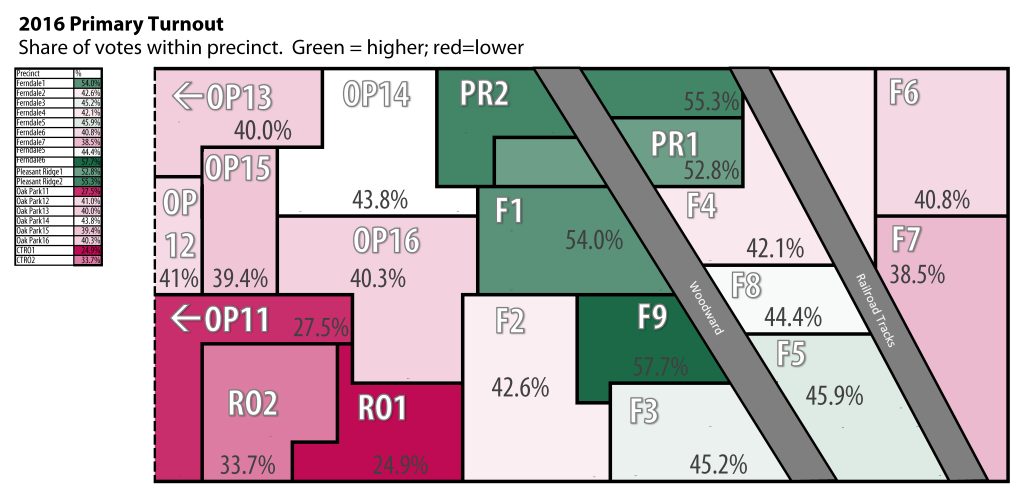 Partisanship shows different patterns but they are similarly strong: Republicans in this area are concentrated in the north and east, but it is important (as we can see later) that these are different kinds of Republicans. And even the highest level of concentration of Republicans in this district is still no more than 1/3. Democrats concentrate in south-central Ferndale and then even more in the precincts to the West in Oak Park and Royal Oak Township.
Within the Democratic vote, the concentrated areas of Democrats in Ferndale are rather different from the concentrated areas of Democrats in Oak Park and Royal Oak Township. Ferndale’s Democratic areas are also its Sanders Zones, with 2:1 Sanders voters. The Clinton Zones are in the west, in Oak Park and Royal Oak Township with a nearly 3:1 advantage for Clinton.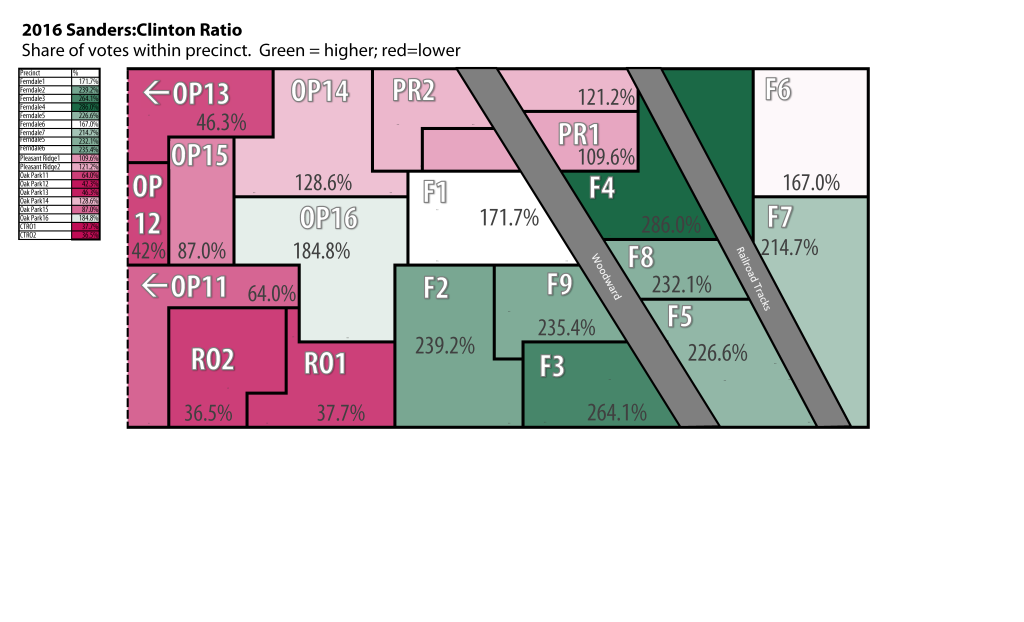
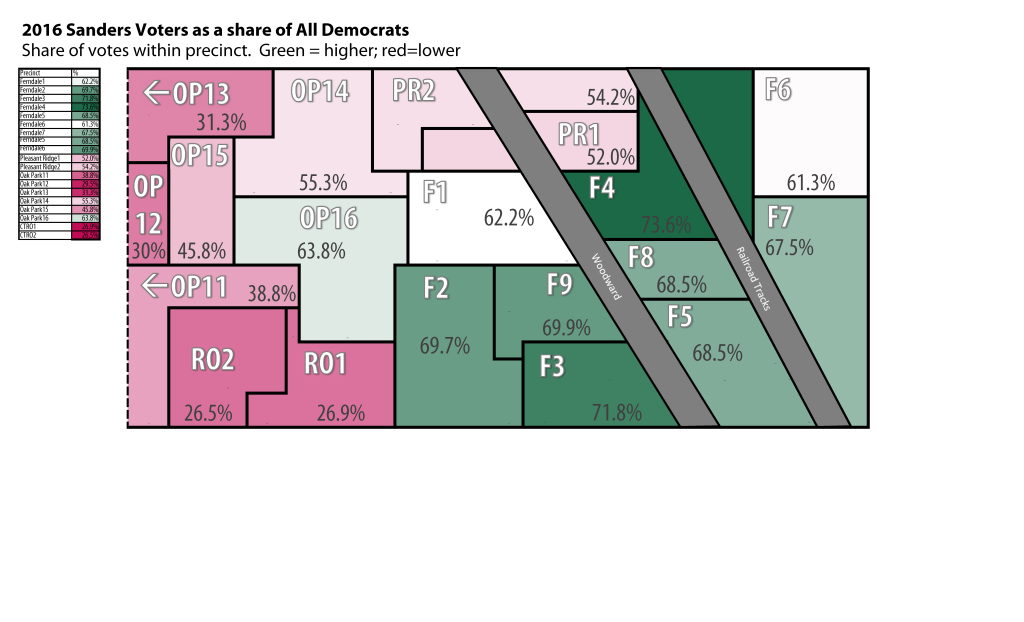
The result is that even though Royal Oak Township and Oak Park are rich with Democratic voters, they are still among the poorest areas for Sanders, even worse than some of the not-that-Democratic areas in Ferndale’s north and east..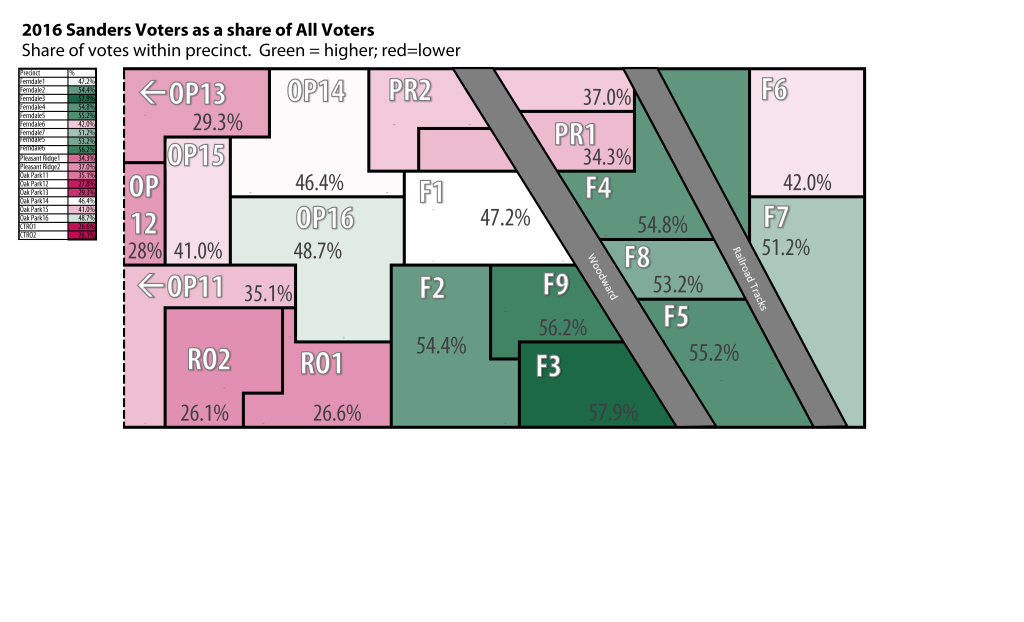
On the Republican side, the battle lines are not quite as easy to draw, but I’ll start with a simple binary opposition between the candidates that the Republican Party establishment fear (Trump, and in a different way, Cruz) and those who have received more establishment endorsements and support (Rubio and Kasich). The patterns here are not quite as clear, but what stands out is that the more heavily Republican areas within Ferndale and Pleasant Ridge are actually quite different: As the map above shows, there are more Republicans than average in a semicircle arcing from the top center of the map (Pleasant Ridge) to the lower-right/southeast. But this semicircle is intensely split between Pleasant Ridge, which voted Kasich/Rubio 2:1 over Trump/Cruz, to southeast Ferndale which voted for Trump/Cruz by precisely the same ratio.
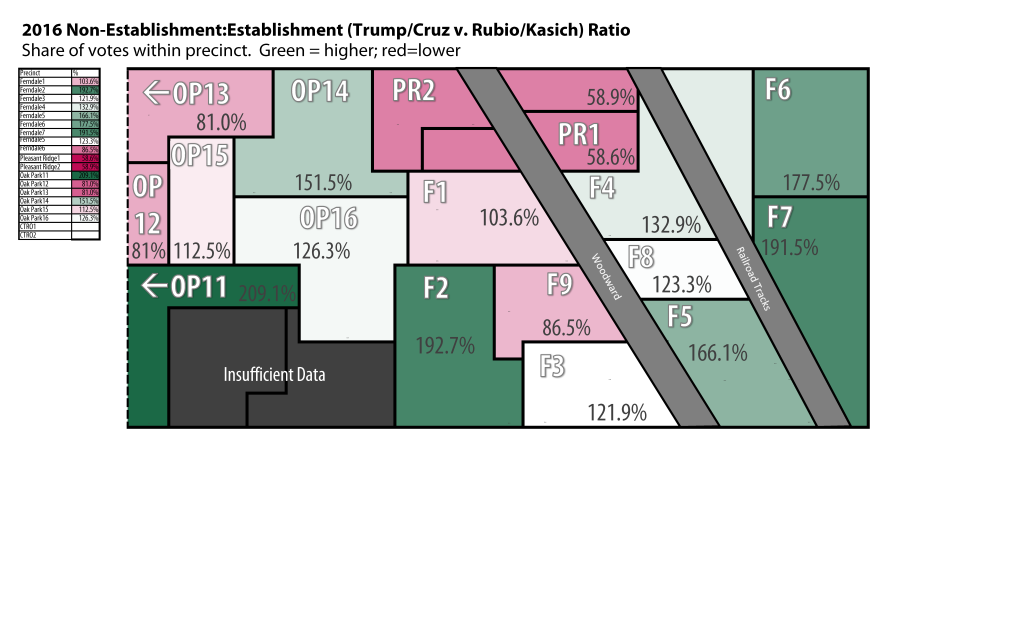
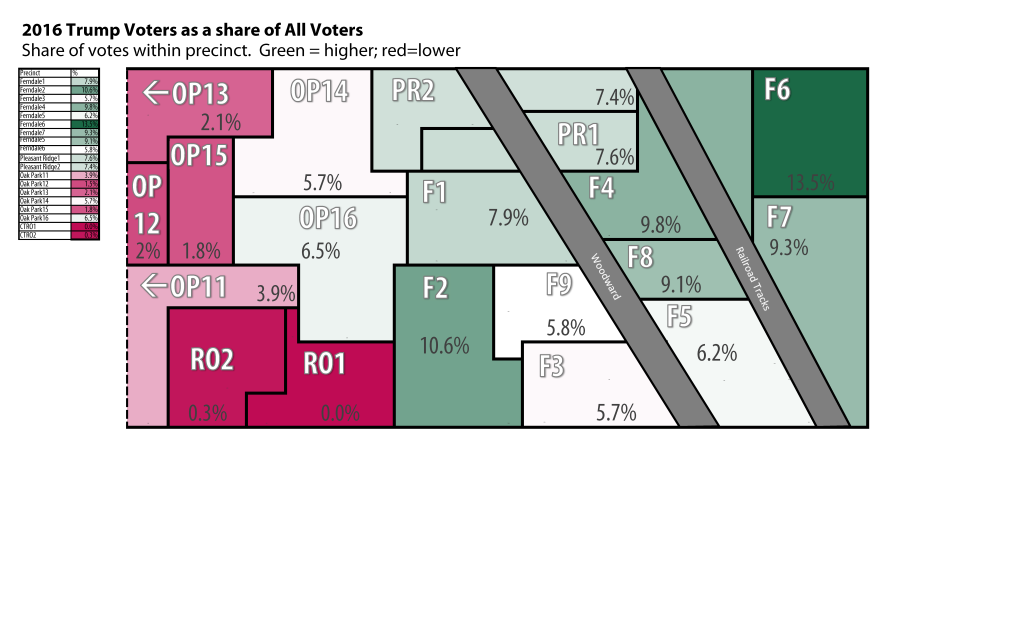
In specific terms of support for Trump, we see his support concentrated in Ferndale’s northeast (with a share of Republican voters for Trump that is slightly above the statewide average) and also in Ferndale’s southwest i precinct 2. But this latter phenomenon is at least in part a question of the precinct’s relatively small number of Republican voters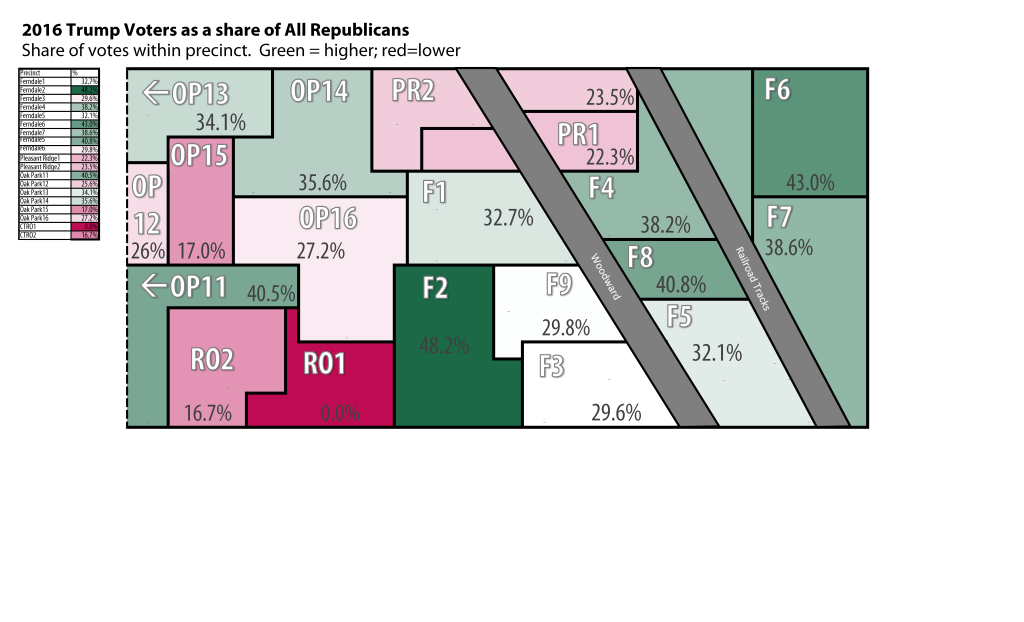
Looking at the map overall, we can see that the combination of high Republican support and high Trump support makes northeast Ferndale Trump’s core.. This is Sanders’ weakest precinct in Ferndale but not Clinton’s, so the battle there (if both get the nomination) will be one worth watching.
Source: http://results.enr.clarityelections.com/MI/Oakland/59377/163183/en/summary.html

I put a small bet on Sanders at 30.00 (i.e. odds of 29-1 or +2900) on Monday. He’s shortened quite a bit to 18.00 since then.
It looks like the polls are completely missing the younger voters on both sides of the Atlantic.
Are you going to update http://www.pozorblog.com/wp-content/uploads/2012/03/slovakia-2012-ebb-flow.png ?
It’s one of the graphics on here I share the most – obviously apart from the voter guide flowcharts :)