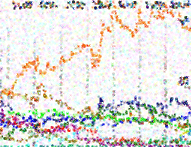
 Two-and-a-half months ago I finished up a blog post on poll predictiveness with a cliffhanger:
This question has driven experts to find a variety of proxy measures to figure out how to adjust polling numbers to reflect the final outcomes. This post is already too long, however, so that will have to wait for another post.
By now readers have no doubt forgotten that they have been hanging on in suspense and have moved on to other important things, but I have not forgotten the promise. Indeed I could not since this is one of the two biggest questions that shape how we look at poll numbers in Slovakia (the other is the threshold, which I will deal with in the next part of this series) and since the issue has surfaced in nearly every major Slovak daily. No refer to just a few:
- March 12, 2010, SME, “There are still many voters in flux“
- April 6, 2010, Hospodarske Noviny Online, “KDH has the most solid voters“
- April 25, 2010, SME, “According to experts polls will differ results“
- April 29, 2010, Hospodarske Noviny Online, “All-time low turnout looms in elections“
Each of these articles refers to methods by which one might try to put poll numbers in context, with the ultimate goal, the grail, to make a better prediction of election results. On the one hand some articles, such as the most recent one from SME, say that this can’t really be done–that it depends too much on idiosyncratic behaviors and random events. Other articles, such as the one in Hospodarske Noviny suggest that the firmness of voter commitment might offer some clues that would allow us to make better predictions. Others have suggested factors such as voter turnout likelihood, measured either by surveys or by past polls. Recent trends may also play a role in shaping how people decide when they actually enter the voting booth. These all seem plausible, but rather than take any of these potential influences as real, it is worth testing them to see if they do have any relationship to the difference between polls and actually election outcomes.
The Role of Voter Loyalty
It seems quite plausible to assume that for two otherwise identical parties, the party whose voters are more committed to voting for it will perform better. It seems plausible, the, that polls (which usually don’t ask about degree of committment) will tend to underestimate the election-day performance of parties with more committed voters. And this should give us a tool for making better predictions.
But it doesn’t.
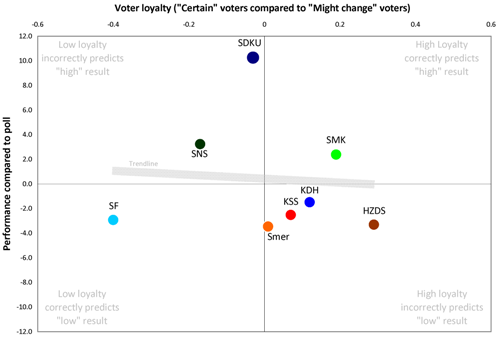
At least it didn’t in 2006. Below is the first in a series of graphs that looks at the relationship between potential sources of “poll adjustment,” such as “voter committment,” on the x- or horizontal-axis and the actual predictiveness of polls (specifically the difference between election results and poll results) on the y- or vertical-axis. If a source of adjustment is useful, the graph should follow a straight line between lower left and upper right (in other words, parties which score “low” on whatever factor also underperform polls while parties that score high overperform polls).
The graph for “voter loyalty” (measured here as the difference in a March FOCUS poll between those supporters of a party who say they will “definitely” vote for the party and those who say they “might change” their minds) suggest that this data source does not allow us to improve our assessments.
In fact, there is a slightly negative relationship between loyalty and support. The factor of loyalty might help explain why the longstanding SMK did better than expected and why the relatively new and weak SF did worse (which, if true, might suggest a discounting of current preferences for SaS), but it does not explain the overperformance of SDKU (except to the extent that SF voters may have shifted to that party, something not factored into the “loyalty” question). More to the point, perhaps, it also does not explain the underperformance of HZDS, which in 2006 had the most loyal voters of all. “Committment” may have something to do with it, but if it does, the interaction is too complicated for this single piece of information to produce any meaningful insights. So HN may be right in pointing out that KDH voters are the most “solid” but that does not help much.
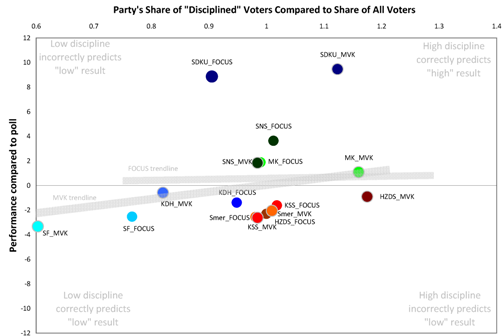
A related factor–perhaps very closely related–was cited by ING Bank in its own quite thorough 2006 analysis of the prospective election results which circulated before the elections. The bank’s report, which unfortunately did not contain full footnotes, cited two measures of voter “discipline” and compared the share of “disciplined” voters committed parties to the share of voters overall. Here again, a party with more “disciplined voters” should in theory have a better chance of outperforming the polls than a party with fewer disciplined voters. Unfortunately, I do not know how they defined “disciplined” and I have a feeling that it is simply another way of calculating the same “loyalty” data above. Since I don’t know whether it means anything, I analyze the results here only to demonstrate that the same results emerge for polls by both FOCUS and MVK (and therefore that this is not simply an artifact of FOCUS polling).
The trendlines here are essentially flat, suggesting no relationship. The MVK results have a slightly positive trend, but not by much and the overall pattern is murky: again it works for SF and, with MVK, for SMK and SDKU but not for SDKU in the FOCUS survey or HZDS in the MVK survey.
The Role of Party-Voter Turnout
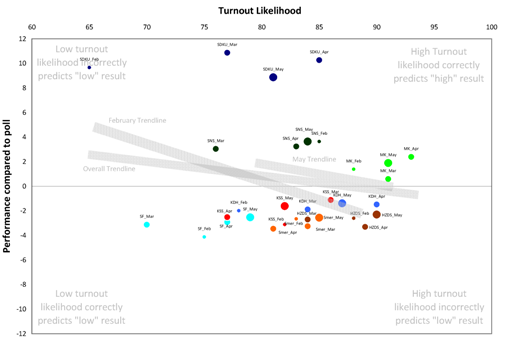
The voting decision is actually twofold: alongside the question of whom to vote for is the question of whether to vote at all. The preference question itself does not measure whether those who prefer a party will actually make it to the polls on election day. In theory those parties with voters who were more likely to go out and vote would do better than others and therefour outperform the polls. We have data on this because in 2006 the pre-election FOCUS polls regularly asked about likelihood of participation. The graph below combines the results for all major parties over four months and shows the relationship-line for the February data, the May data and the data for all four months aggregated together.
As with the loyalty data, the trendlines here point down, suggesting that knowing the likelihood of voter turnout for a party does not help figure out whether the party will perform better than the polls. This figure works for the same parties as loyalty–SMK in the positive, SF in the negative–and fails for the same parties as loyalty–SDKU and SNS outperform likely turnout while HZDS underperforms. Of course there may be a reciprocal relationship here between SDKU and SF and between SNS and HZDS, but the point here is that the loyalty and turnout figures alone do not tell us that information and cannot be used to specify our predictions.
Previous Polls
An even more direct way to estimate the overperformance or underperformance of parties compared to polls is to look at the performance in the previous election. In 2006 I set out to create a prediction model based largely on this principle, looking at the gap between past polls and past actual results using the 2002 Slovakia parliamentary election and 2004 Europarliament election and suggesting a relationship between differences in turnout (medium in 2002, very low in 2006) and differences between party polls and party performance. The model did not work. Or more precisely, it worked so idiosyncratically that it was not useful: it worked well for SDKU and SF and badly for most of the rest. The graph below demonstrates the weakness of that attempt: the
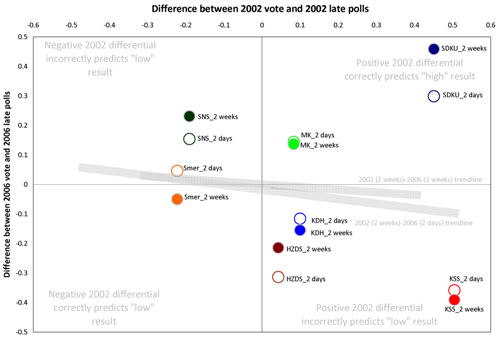
The graph shows two sets of dots because there is a slight comparability problem: in 2002 the law forbade polls within the last two weeks of elections whereas in 2006 it did not. The graph above shows differences between polls and results as a percentage of the poll figures in 2002 compared to 2006 for both the 2006 polls taken immediately before the election (white circles and colored rims) and those taken in a more comparable 2-4 week period before election (colored circles and gray rims). In both cases, the results are the same: predictiveness of polls in 2002 did not help assess predictiveness in 2006 except for SDKU, SMK and Smer (but only the 2 week prediction and not the election day prediction). It would appear that too many other variables affect the parties and polls over time for this method to work well.
What we need, then, is some kind of indicator that itself incorporates a significant share of the factors that shape poll predictiveness.
Oddsmakers and Experts
One way of assembling and integrating relevant factors is to find a smart and trustworthy person who has already done it. It is even better if the person (unlike the author of this blog) stands to lose some tangible resources if the predictions are wrong. There are not many public sources for this kind of information for Slovakia. Political scientists, pollsters and journalists (precisely because they do have something to lose–reputation and perhaps even revenue) tend to keep their predictions to themselves. And there is not yet a widespread public odds market in which individual buying and selling of shares offers a glimpse into public assessment of probabilities (a mechanism which has been extremely effective in predicting close races in the United States) except in SME‘s ambitious effort, which at least for now does not seem to involve real losses or gains or a particularly large base of participants (though that does not mean that the collective wisdom of SME‘s readers won’t be correct, and the consensus I see there is not implausible) .
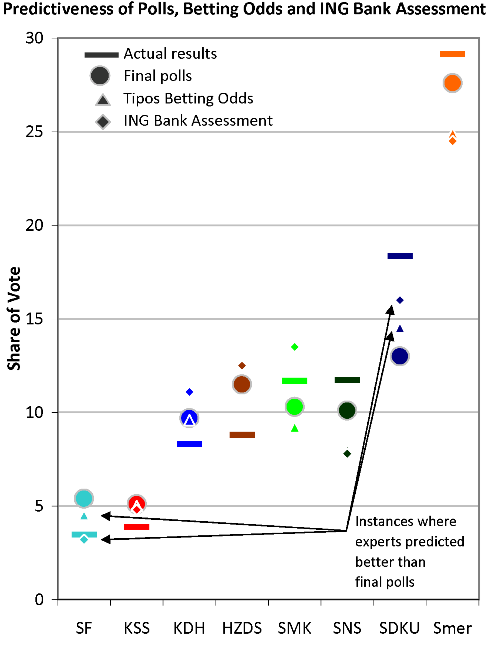
What we have instead are two rather thin reeds: in 2006 the firm Tipos.sk allowed public betting on election questions, though the odds were established by the bookmakers themselves and only occasionally updated rather than in a true shares market (and which can be reverse-engineered into an assessment of the bookmaker’s own predicition); and in that same year an assessment by an analyst at ING Bank became public (though not necessarily with the encouragement of the bank). I am sure there are other analyses floating around by political risk mangement firms, but I don’t have access to them (though if readers do and can share them, even for past elections, I would be extremely grateful). The question is whether these expert opinions do much better than the raw data. The answer is no, as the chart and graph below show. In only 4 cases out of 16 did the expert opinion do better than the actual final polls in predicting the outcome (and in this cases for the likely suspects: SF, with its weak base, and SDKU with its past history of significant underestimation) while in 7 of 16 cases the expert opinion did rather worse than the actual data. Of course these analyses emerged more than a month before the actual election and, to be fair, they actually performed slightly better than the poll estimates from May polls, so experts do have their (slight in this case) value for those needing their predictions well in advance.
The best tool I can find: Pre-election trends
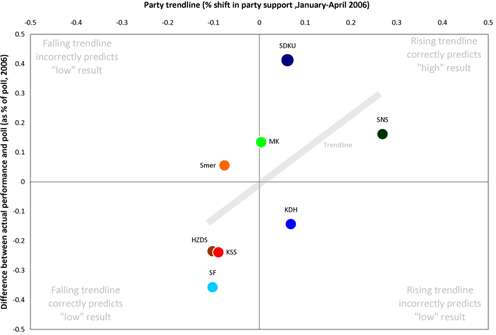
In the process of testing all of these various mechanisms for prediction, I decided to try one last method: does a party’s trajectory actually affect its final outcome? In this case the theory suggests it should not have much of an effect: when polls are taken up to the last minute, then trends themselves should not shape the final decision. It is possible, however, that a voters’ sense of trend might bring a reluctance to vote for a declining party or an enhanced willingness to vote for one on the rise. And lo, when I ran the numbers the results came out shockingly clear: in 2006 a party’s trendline for January through April had a clear relationship to the party’s tendency to over- or underperform polls:
This source of information correctly predicts 5 of the 8 and incorrectly predicts only 2 (and then only by narrow margins). The dots are grouped tightly around the line, suggesting a strong relationship. It is as if the election results followed the trendlines, but at levels they would have produced in July or August rather than June; the experience of going into the voting booth may force the kind of concentration that pushes voters to become the extrapolation of trends.
A strong caveat: I am hesitant to take this too far, especially since I have not been able to put together a time series for previous elections or in other countries, but the initial results suggest that the past trend is something worth attending to.
A word about prediction, caveat be damned. So what would this flawed (but not as flawed as the other methods I’ve looked at here) say about Slovakia’s upcoming 2010 election? Well it is necessary to begin by looking at the 2010 four-month trends. There are, of course, several ways to calculate the trend, averaging individual poll trends or aggregating all poll data together. The results and relative positions of parties are reasonably similar, however. The following table gives the range:
| Party | Trend | Change |
| SaS | Significantly positive | +60% to +80% |
| KDH | Moderately positive | +10% to +13% |
| SMK | Slightly positive | +7% to +11% |
| MOST | Slightly positive | +2% to +8% |
| SNS | Mixed | -5% to +8% |
| SDKU | Flat | 0% to +1% |
| Smer | Moderately negative | -10% to -12% |
| HZDS | Significantly negative | -10% to -23% |
This is good news for SaS (especially since if the question of “loyalty” and “discipline” are relevant anywhere it is for new parties such as SaS whose positive trend here may be enough for it to overcome the at-the-polls reluctance that kept SF from parliament in 2006) and not bad news for KDH, though this party seems locked into a 9.5%±1.5% performance zone regardless of external circumstances. The news Smer is not good–but this is not unexpected, since the even party elites know that their party gathered a significant amount of soft support during its more successful years–but not catastrophic since Smer has a huge lead over the next largest party. The worst news is for HZDS which has both the strongest negative trend in recent months and the least cushion to offset any losses. If the trendline factor found in 2006 applies in 2010 then HZDS will not make it into parliament. A big if.
For the other parties the prediction is far less clear.
- I suspect this model does not apply at all to Most-Hid and SMK since the intra-ethnic competition takes a quite different form. Of course this makes all of the above assessments rather useless since this is what everybody wants to know.
- For SDKU the neutral trend is probably about right. In the past the party has benefitted from last minute decisions by voters to stick with the tried and true on the right. With a revived KDH and a solid alternative in SaS (barring any mistakes by the party or revelations about it in the next month), SDKU will likely not see the big jump that it saw in 2006 or 2002. Its has a good chance of being the strongest of the right-wing parties, but probably not by too great a margin.
- As for SNS, it is an open question. In the last four months, SNS saw a general decline offset by a major rise in a single poll: FOCUS in April. Take out that one data point and SNS shows a trend in the last four months that matches its sharp decline over the past full year. It is for that reason that I am keen to see the April Median poll–not for level but for trend–and especially the May FOCUS trend. If FOCUS in May puts SNS back under 6% then the party may be in real trouble. The threshold will have a big impact on the shape the next government (the topic for the next post, I hope.)


Thank you, Kevin, this is a compelling addition to your analyses. An aspect of this probably is not just what the opinion polls show, but what of that gets highlighted and reported on more extensively by the media.
For instance, the amount of reporting on any rise in the preferences for SaS, often accompanied by its leader’s pic (unlike with reports on the other parties), easily beats reporting on other parties at Slovakia’s major news sites. That, the amount and nature of reporting on them as opposed to the op-poll trends themselves, may also include part of the answer to what you say about the possible low predictability of the trends themselves with Most-Híd and SMK.