
UVVM Monthly Report for December 2008
If you set your frame narrowly enough, things can change quickly. In the big picture, nothing much has changed since last month, and the relative positions of parties are pretty much as they have been for the last two years. Within that narrow frame, however, the current coalition has gone from near-highs for the post election period to near-lows thanks to drops in all three of the coalition parties, the first time all three have dropped simultaneously since late 2006.
Of the three, Smer’s drop was the largest but by far the smallest in percentage terms and the drop occurred after one of the party’s near-high scores, so some correction may be expected. This month’s 46% is still one of the party’s eight highest scores over the last 30 months.
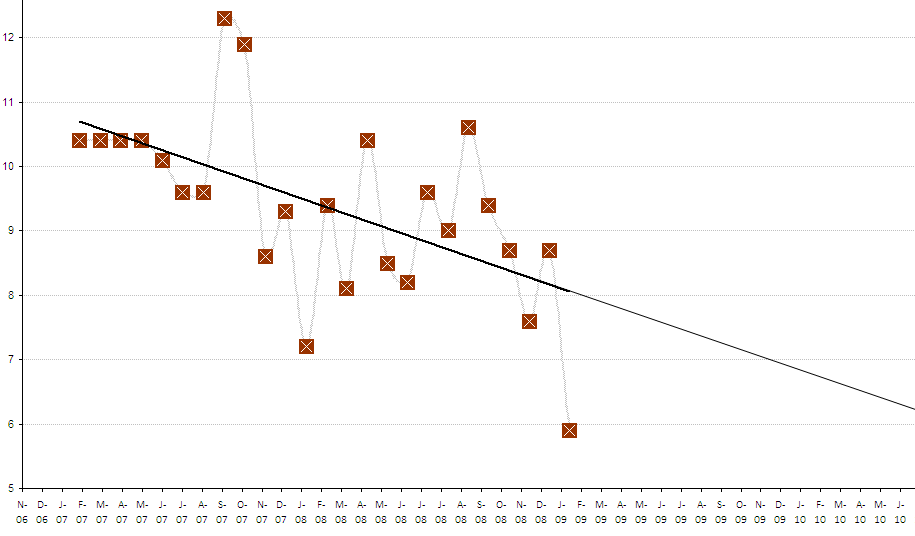
For the other coalition parties, the drop was more significant, with SNS sliding back toward the 11% mark after a high point late in 2008 and HZDS dropping to its lowest mark ever recorded in a major survey, the first time the party has ever received less than 6%. Of course there is a lot of noise with smaller parties, but HZDS’s tendency to hit new lows every six months or so and its inability for its occasional highs to rise to the levels of previous highs cannot be happy news within the party. The graph below suggests that the party is not yet in danger of dropping below the 5% threshold in the 2010 election, but the danger is getting closer, particularly since party regularly varies more than 1% from its trendline average meaning that with current trends there is a strong chance that the party will post at least one or two results below the 5% threshold in the months just before elections, a symbolic result that could further hurt the party’s chances.
For the opposition parties in parliament, this was a good month, especially for KDH which seemed to be facing a slide as serious as that of HZDS. Again there is a lot of noise and variation here but this gives the party a brief reprieve. Overall, as the graph below shows, the opposition parties are back near their high point for the post election period. Unfortunately for them, this is a paltry 33%.
And unfortunately for them, Smer is still within striking range of a one-party government.
As always, the actual polling numbers are available online at Google Docs:
http://spreadsheets.google.com/pub?key=pdhlCClsiyAMi39bLFpY_Zg And the most recent three months are at the bottom in tabular format (using “iframe” which may not work on all browsers).
It is worth noting here, however that UVVM has changed its method for asking about voter participation and that this can have effects on the overall results. As the table below shows, UVVM has changed its question three times in the last two years, switching to a “Do not sympathize with any” response after the 2006 election and then in 2007 changing back to the method it used before which allows a “will not vote” response. This new option lowered the number of people who specified a party from an average 0f 74% to an average of 68% (though increasing disillusionment with all parties could explain some of the decline). Now UVVM has split the question into two parts, first asking whether respondents will vote at all and then asking whether for whom they will vote. Asking first about voting has the immediate effect of increasing the share of “will not vote” responses by 8 percentage points. In the second phase, the survey asks those who will vote to specify a party and here too it allows a “do not know” response. Between the 8 point increase in “will not vote” and the 3 point increase in the combined “do not know” (respondents who do not know if they will vote and those who do not know for whom they will vote), this method produces an 11 point drop in those who actually specify a party. Whether this is good or bad is hard to say. It suggests a lower level of turnout–and I suspect the purpose of the shift is to fix UVVM’s overprediction of turnout in 2006–but whether it is a more accurate measure of results is hard to say. It is notable that it does not substantially alter the overall party preferences, all of which stay within a few percentage points of their numbers using the old method. Of course the only way to really test the effect is to ask both sets of questions at the same time, but this would double the expense. More news on this as I find out any details.
| 2006 | 2007-2008 | 2009 | |||||
| For whom will you vote? | For whom will you vote? | Will you vote? | For those answering “Will vote”: For whom will you vote? |
||||
| Does not sympatize with any | 26.4 | ||||||
| Will not vote | 17.9 | Will not vote | 25.0 | ||||
| Does not know who to vote for | 14.2 | ||||||
| Does not know whether to vote | 11.4 | ||||||
| Will vote | 63.6 | ||||||
| Specifies party | 73.6 | Specifies party | 67.9 | Does not know whom to vote for | 6.2 | ||
| Specifies party | 57.4 | ||||||
Finally, I should note that like MVK and FOCUS, UVVM appears to have added the Party of Greens (SZ) to its list of parties on the official roster. At some point I will rework my software to include them here, but for the moment they remain at a single percentage point (close to the results obtained by FOCUS in January) and so not much is lost by their omission. It is noteworthy that only one in a thousand respondents (here it can only be one out of the 600 asked) specified a party not on the list, suggesting that there is no spontaneous support for KDS, Liga, or SaS.
<br />